Categories in Colomiers
Industries
Business Distribution by Industry in Colomiers
| Industry Description | Number of Establishments | Average Age of Business |
|---|---|---|
| Corporate management | 176 | 20 years |
| Health and medical | 150 | 25 years |
| Restaurants | 135 | 18 years |
| Real estate | 108 | 24 years |
| Shopping | 106 | 18 years |
| Technical construction services | 85 | 20 years |
| Car repair | 82 | 19 years |
| Other construction | 81 | 17 years |
| Education | 78 | 39 years |
| Beauty salons | 74 | 15 years |
| Construction of buildings | 68 | 27 years |
| Dentists | 67 | — |
| Electronics stores | 65 | 19 years |
| Shopping other | 60 | 19 years |
| Wholesale of machinery | 59 | 37 years |
| Alternative medicine | 58 | — |
| Nurses | 57 | — |
| Hairdressers | 54 | 19 years |
Colomiers Facts
| Area | 21.3 km² |
| Population | 40,118 |
| Male Population | 19,654 (49.0%) |
| Female Population | 20,464 (51.0%) |
| Population change (1975 to 2020) | +105.2% |
| Population change (2000 to 2020) | +32.7% |
| Median Age | 37.3 years (Male: 35.1, Female: 39.4) |
| Neighborhoods | Bascule - Oratoire, Centre, Perget, Cabirol - Ramassiers, Saint Martin du Touch |
| Local Time | |
| Timezone | Central European Summer Time |
| Lat & Lng | 43.61058, 1.33467 |
| Postal Codes | 31770, 31771 CEDEX, 31772 CEDEX, 31773 CEDEX, 31774 CEDEX, More |
Map of Colomiers
Interactive Map
Colomiers Population
Years 1975 to 2020
| Data | 1975 | 1990 | 2000 | 2015 | 2020 |
|---|---|---|---|---|---|
| Population | 19,549 | 25,638 | 30,227 | 38,695 | 40,118 |
| Population Density | 917.3 / km² | 1,203 / km² | 1,418.3 / km² | 1,815.6 / km² | 1,882.4 / km² |
Colomiers Population change from 2000 to 2015
Increase of 28% from year 2000 to 2015
| Location | Change since 1975 | Change since 1990 | Change since 2000 |
|---|---|---|---|
| Colomiers | +97.9% | +50.9% | +28% |
| France | +22.7% | +13.8% | +8.8% |
Colomiers Median Age
Median Age: 37.3 years
| Location | Median Age | Median Age (Female) | Median Age (Male) |
|---|---|---|---|
| Colomiers | 37.3 yrs | 39.4 yrs | 35.1 yrs |
| France | 39.6 yrs | 41 yrs | 38.1 yrs |
Colomiers Population Density
Population Density: 1,882 / km²
| Location | Population | Area | Density |
|---|---|---|---|
| Colomiers | 40,118 | 21.3 km² | 1,882 / km² |
| France | 65.9 million | 638,022.5 km² | 103 / km² |
Colomiers Historical and Projected Population
Estimated Population from 1300 to 2100
- JRC (European Commission's Joint Research Centre) work on the GHS built-up grid
- CIESIN (Center for International Earth Science Information Network)
- [Link] Klein Goldewijk, K., Beusen, A., Doelman, J., and Stehfest, E.: Anthropogenic land use estimates for the Holocene – HYDE 3.2, Earth Syst. Sci. Data, 9, 927–953, https://doi.org/10.5194/essd-9-927-2017, 2017.
Neighborhoods in Colomiers
Percentage of businesses by neighborhood in Colomiers
Area Codes
Percentage Area Codes used by businesses in Colomiers
Price Distribution
Business distribution by price for Colomiers
Human Development Index (HDI)
Statistic composite index of life expectancy, education, and per capita income.
Colomiers CO2 Emissions
Carbon Dioxide (CO2) Emissions Per Capita in Tonnes Per Year
| Location | CO2 Emissions | CO2 Emissions Per Capita | CO2 Emissions Intensity |
|---|---|---|---|
| Colomiers | 321,325 tn | 8.01 tn | 15,076.8 tons/km² |
| France | 485,797,691 tn | 7.38 tn | 761.4 tons/km² |
| 2013 CO2 emissions (tonnes/year) | 321,325 tn |
| 2013 CO2 emissions (tonnes/year) per capita | 8.01 tn |
| 2013 CO2 emissions intensity (tonnes/km²/year) | 15,076.8 tons/km² |
Recent Nearby Earthquakes
Magnitude 3.0 and greater
| Date▼ | Time↕ | Magnitude↕ | Distance↕ | Depth↕ | Location↕ | Link |
|---|---|---|---|---|---|---|
| 7/18/04 | 2:16 AM | 3.8 | 80.4 km | 10,000 m | Pyrenees | usgs.gov |
| 9/21/01 | 8:17 AM | 3.3 | 8.7 km | 0 m | France | usgs.gov |
| 10/4/99 | 6:14 PM | 4.4 | 98.9 km | 10,000 m | Pyrenees | usgs.gov |
| 9/4/98 | 5:22 PM | 3.4 | 90.2 km | 2,000 m | Pyrenees | usgs.gov |
| 5/17/96 | 7:18 PM | 3.3 | 94.3 km | 10,000 m | Pyrenees | usgs.gov |
| 3/31/96 | 5:20 PM | 3.2 | 90 km | 10,000 m | France | usgs.gov |
| 6/15/94 | 4:46 AM | 3 | 97.3 km | 10,000 m | Pyrenees | usgs.gov |
| 6/15/94 | 3:33 AM | 3.1 | 99.3 km | 10,000 m | Pyrenees | usgs.gov |
| 11/24/93 | 11:28 PM | 3.3 | 96.6 km | 10,000 m | Pyrenees | usgs.gov |
| 6/6/93 | 1:51 AM | 3.5 | 99.4 km | 14,200 m | France | usgs.gov |
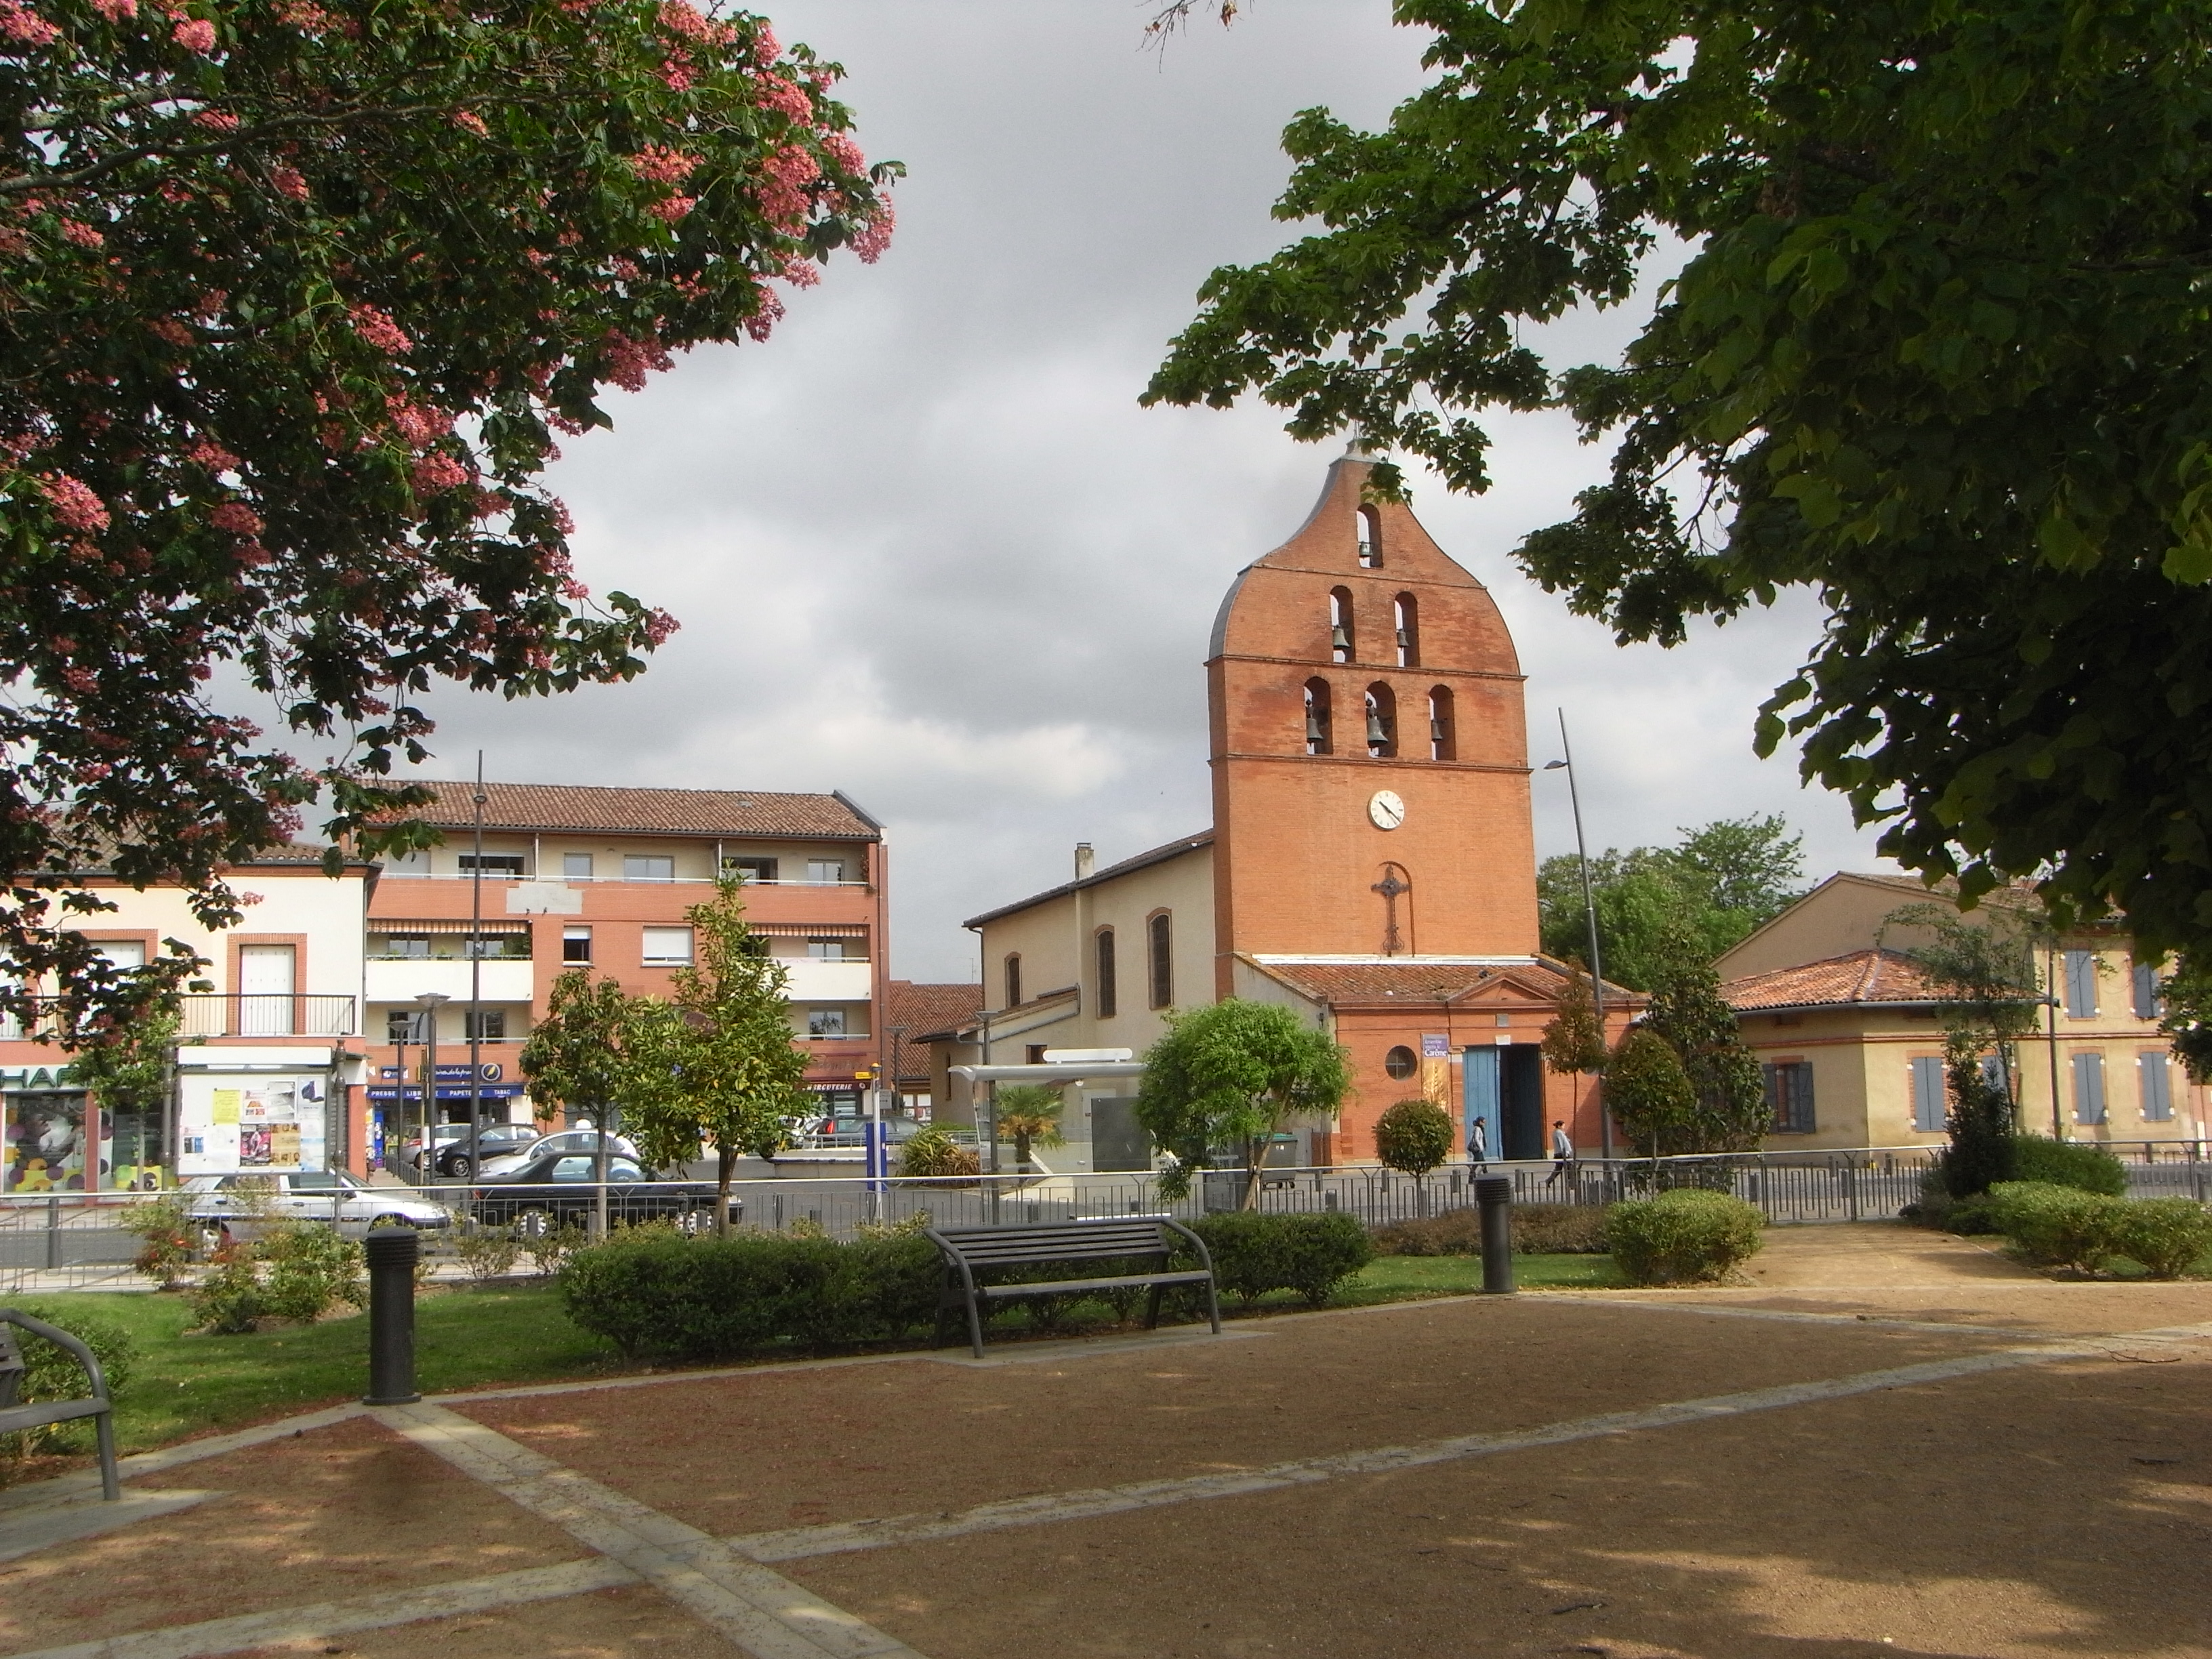
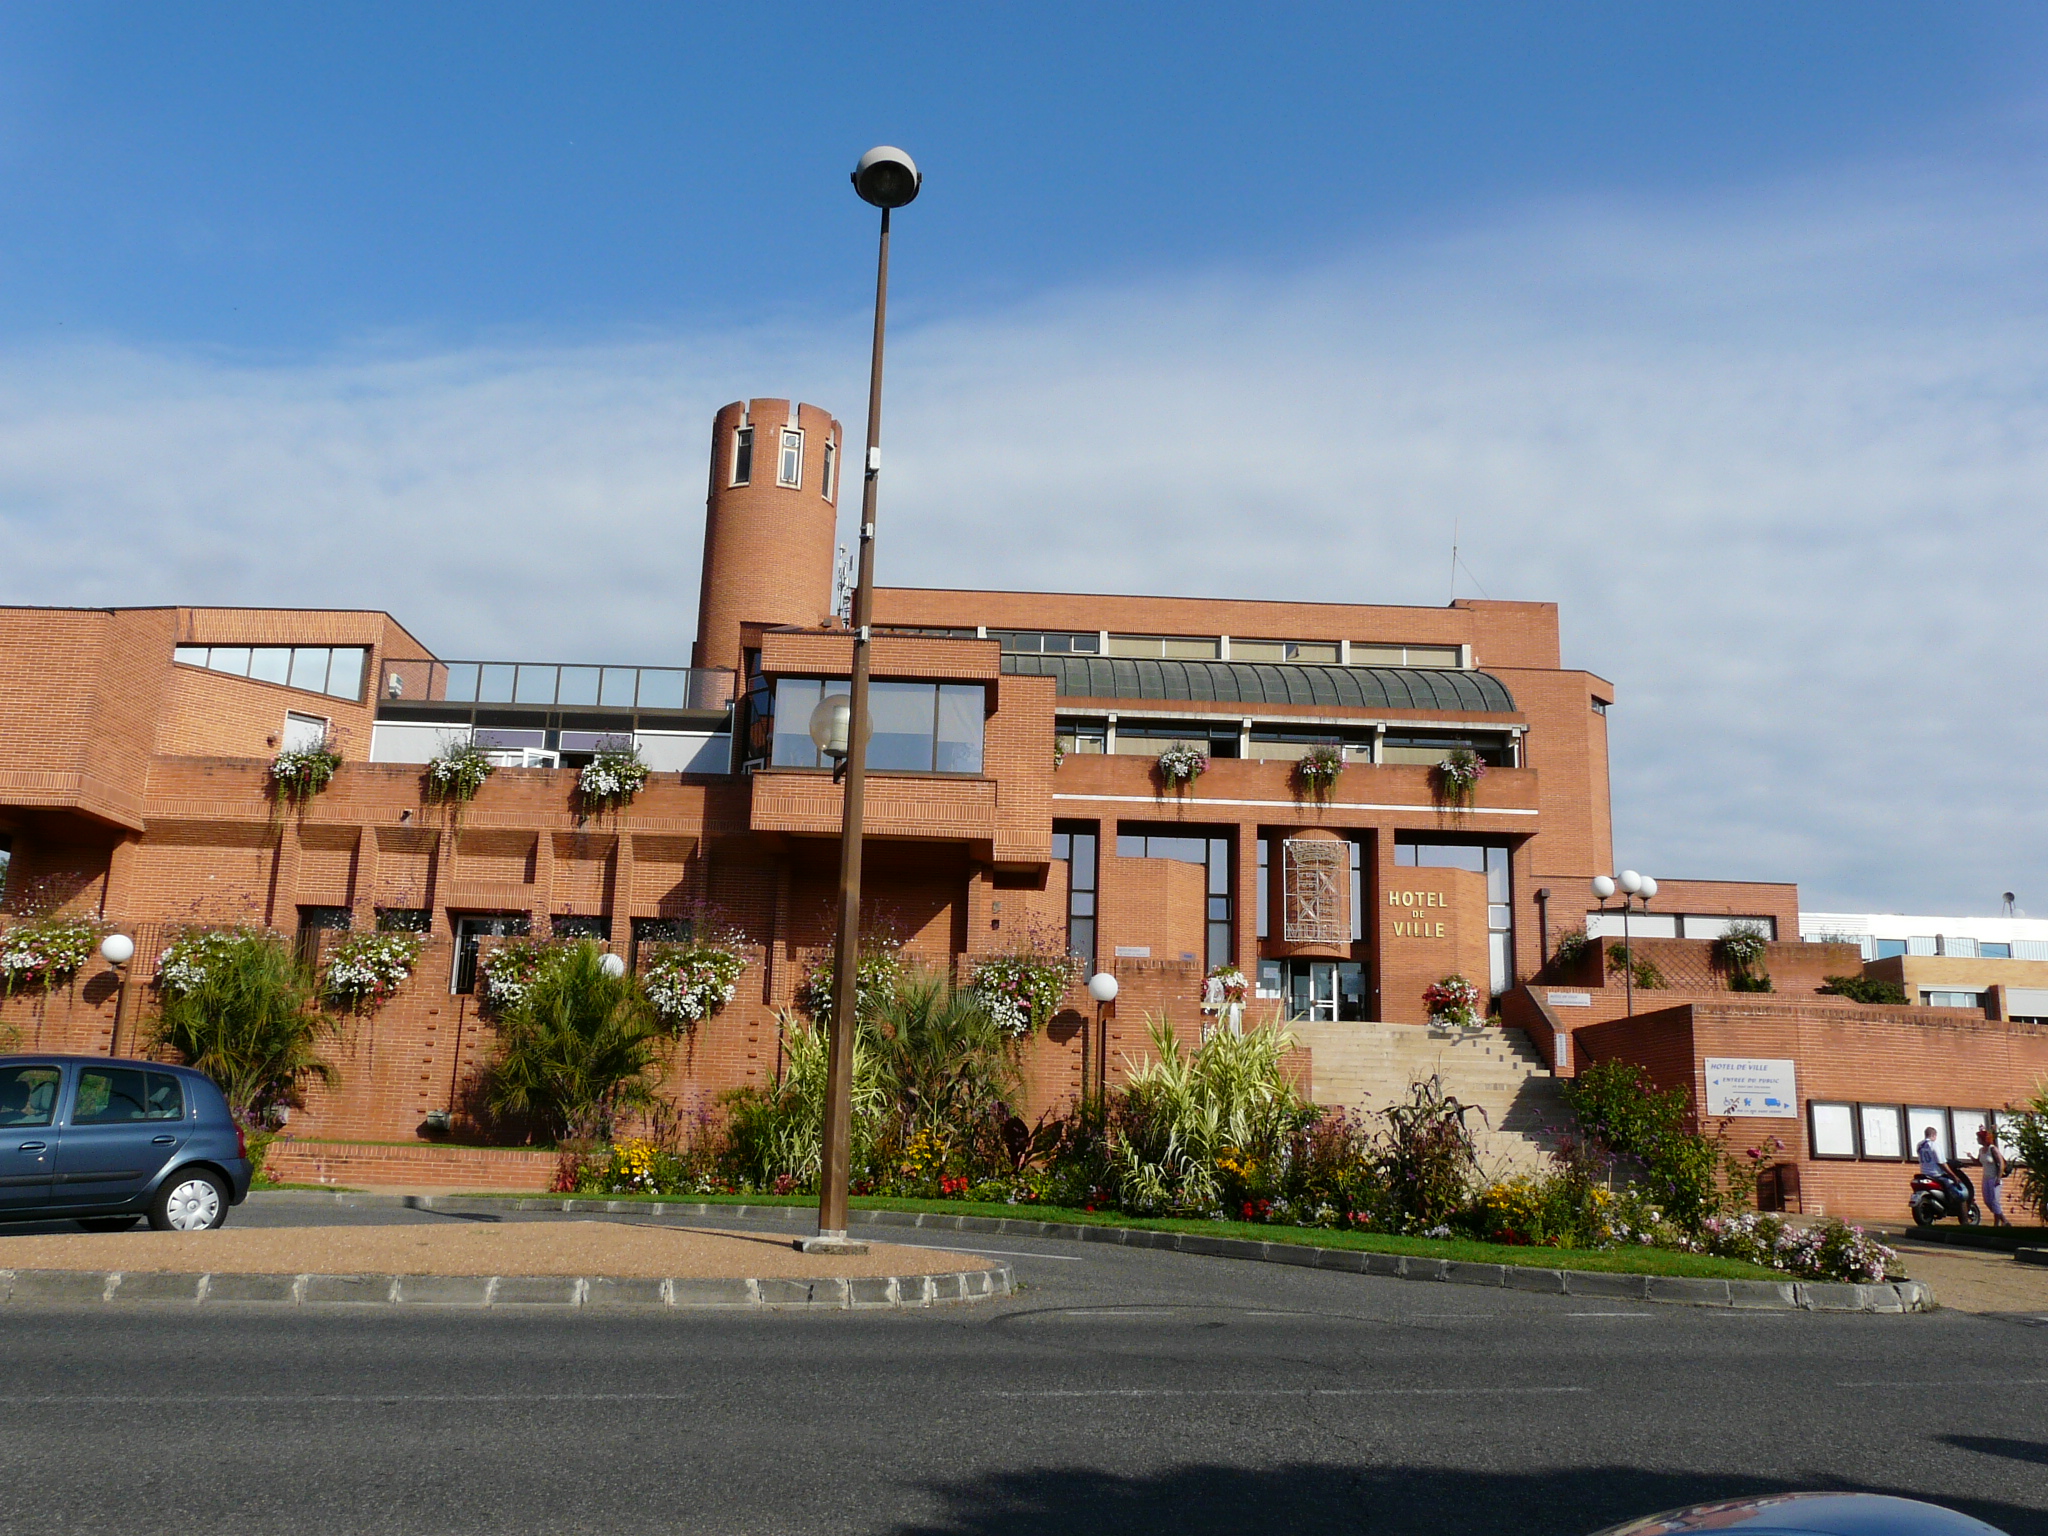
Colomiers
Colomiers is a commune in the Haute-Garonne department in southwestern France. is the largest suburb of the city of Toulouse, and is adjacent to it on the west side. It is a member of the Urban community of Greater Toulouse.
Colomiers Wikipedia Page

About Our Data
The data on this page is estimated using a number of publicly available tools and resources. It is provided without warranty, and could contain inaccuracies. Use at your own risk.