Categories in Libreville
Industries
Business Distribution by Industry in Libreville
| Industry Description | Number of Establishments |
|---|---|
| Restaurants | 457 |
| Corporate management | 323 |
| Education | 321 |
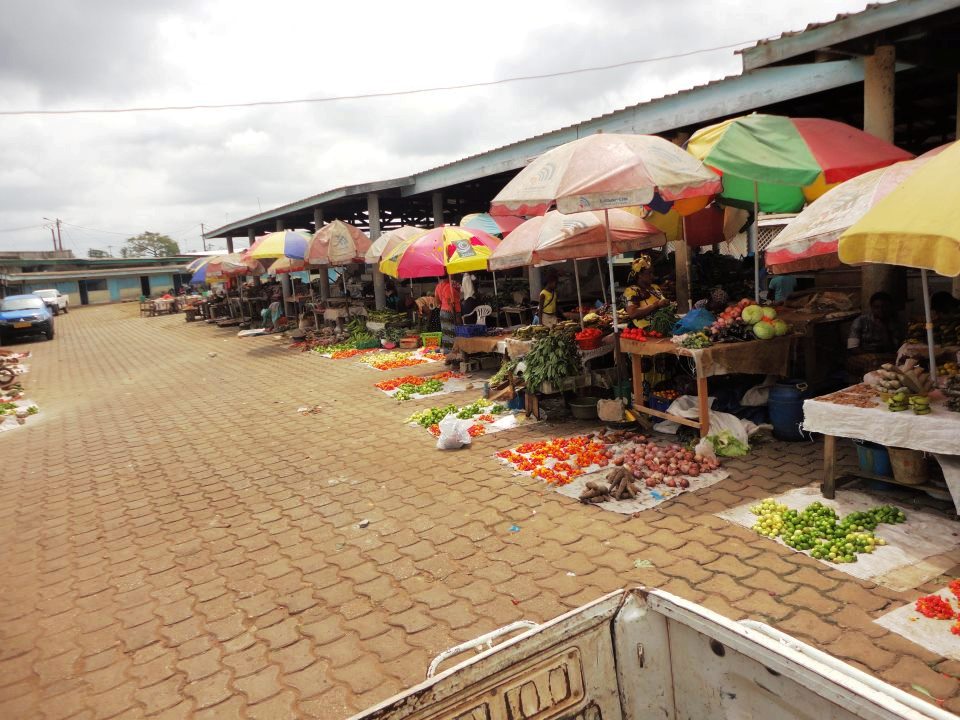
| Shopping | 293 |
| Bars, pubs and taverns | 277 |
| Apartments | 219 |
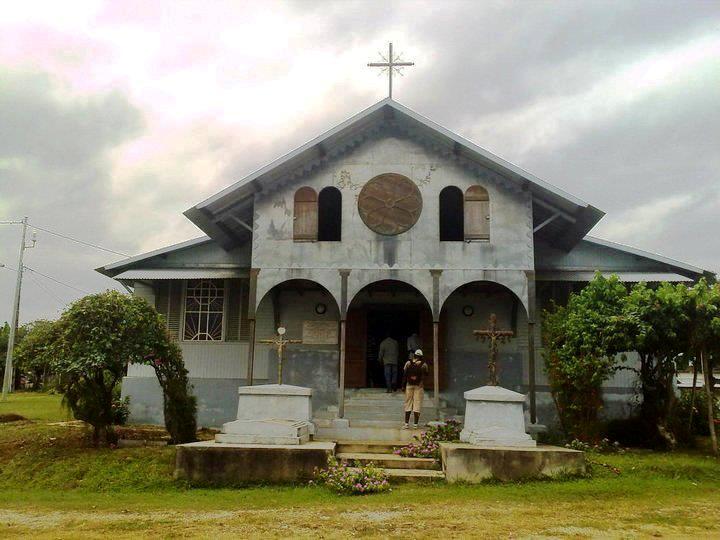
| Churches | 184 |
| Other accommodation | 179 |
| Public administration | 174 |
| Beauty salons | 145 |
| Hotels and motels | 142 |
| Electronics stores | 135 |
| Grocery stores and supermarkets | 128 |
| Real estate | 115 |
Libreville Facts
| Area | 165.1 km² |
| Population | 496,557 |
| Male Population | 249,724 (50.3%) |
| Female Population | 246,833 (49.7%) |
| Population change (1975 to 2020) | +140.3% |
| Population change (2000 to 2020) | +34.8% |
| Median Age | 20.3 years (Male: 20.1, Female: 20.5) |
| Neighborhoods | Quartier Louis, Montagne Sainte, Batavia, Petit Paris, Quartier Derriere Prison |
| Local Time | |
| Timezone | West Africa Time |
| Lat & Lng | 0.39241, 9.45356 |
Map of Libreville
Interactive Map
Libreville Population
Years 1975 to 2020
| Data | 1975 | 1990 | 2000 | 2015 | 2020 |
|---|---|---|---|---|---|
| Population | 206,673 | 297,741 | 368,372 | 461,437 | 496,557 |
| Population Density | 1,252.1 / km² | 1,803.8 / km² | 2,231.7 / km² | 2,795.5 / km² | 3,008.3 / km² |
Libreville Population change from 2000 to 2015
Increase of 25.3% from year 2000 to 2015
| Location | Change since 1975 | Change since 1990 | Change since 2000 |
|---|---|---|---|
| Libreville | +123.3% | +55% | +25.3% |
| Estuaire Province | +127.6% | +59.2% | +27.2% |
| Gabon | +169.6% | +82.4% | +40.8% |
Libreville Median Age
Median Age: 20.3 years
| Location | Median Age | Median Age (Female) | Median Age (Male) |
|---|---|---|---|
| Libreville | 20.3 yrs | 20.5 yrs | 20.1 yrs |
| Estuaire Province | 20.3 yrs | 20.5 yrs | 20.1 yrs |
| Gabon | 20.3 yrs | 20.5 yrs | 20.1 yrs |
Libreville Population Density
Population Density: 3,008 / km²
| Location | Population | Area | Density |
|---|---|---|---|
| Libreville | 496,557 | 165.1 km² | 3,008 / km² |
| Estuaire Province | 647,920 | 19,535.8 km² | 33.2 / km² |
| Gabon | 1.7 million | 262,868.7 km² | 6.4 / km² |
Libreville Historical and Projected Population
Estimated Population from 1840 to 2100
- JRC (European Commission's Joint Research Centre) work on the GHS built-up grid
- CIESIN (Center for International Earth Science Information Network)
- [Link] Klein Goldewijk, K., Beusen, A., Doelman, J., and Stehfest, E.: Anthropogenic land use estimates for the Holocene – HYDE 3.2, Earth Syst. Sci. Data, 9, 927–953, https://doi.org/10.5194/essd-9-927-2017, 2017.
Neighborhoods in Libreville
Percentage of businesses by neighborhood in Libreville
Price Distribution
Business distribution by price for Libreville
Human Development Index (HDI)
Statistic composite index of life expectancy, education, and per capita income.
Libreville CO2 Emissions
Carbon Dioxide (CO2) Emissions Per Capita in Tonnes Per Year
| Location | CO2 Emissions | CO2 Emissions Per Capita | CO2 Emissions Intensity |
|---|---|---|---|
| Libreville | 892,610 tn | 1.8 tn | 5,407.7 tons/km² |
| Estuaire Province | 1,267,072 tn | 1.96 tn | 64.9 tons/km² |
| Gabon | 3,287,773 tn | 1.95 tn | 12.5 tons/km² |
| 2013 CO2 emissions (tonnes/year) | 892,610 tn |
| 2013 CO2 emissions (tonnes/year) per capita | 1.8 tn |
| 2013 CO2 emissions intensity (tonnes/km²/year) | 5,407.7 tons/km² |
Natural Hazards Risk
Relative risk out of 10
| Hazard | Risk Level |
|---|---|
| Earthquake | Low (2) |
* Risk, particularly concerning flood or landslide, may not be for the entire area.
- Dilley, M., R.S. Chen, U. Deichmann, A.L. Lerner-Lam, M. Arnold, J. Agwe, P. Buys, O. Kjekstad, B. Lyon, and G. Yetman. 2005. Natural Disaster Hotspots: A Global Risk Analysis. Washington, D.C.: World Bank. https://doi.org/10.1596/0-8213-5930-4.
- Center for Hazards and Risk Research - CHRR - Columbia University, Center for International Earth Science Information Network - CIESIN - Columbia University. 2005. Global Earthquake Hazard Distribution - Peak Ground Acceleration. Palisades, NY: NASA Socioeconomic Data and Applications Center (SEDAC). https://doi.org/10.7927/H4BZ63ZS.
Libreville
Libreville is the capital and largest city of Gabon, in west central Africa. The city is a port on the Komo River, near the Gulf of Guinea, and a trade center for a timber region. As of 2012 its population was estimated at 797,003.
Libreville Wikipedia Page

About Our Data
The data on this page is estimated using a number of publicly available tools and resources. It is provided without warranty, and could contain inaccuracies. Use at your own risk.