Kulusuk Facts
| Area | 3.6 km² |
| Population | 41 |
| Male Population | 21 (50.7%) |
| Female Population | 20 (49.3%) |
| Population change (1975 to 2015) | +24.2% |
| Population change (2000 to 2015) | -21.2% |
| Median Age | 34.3 years (Male: 40.2, Female: 28.1) |
| Local Time | |
| Timezone | Greenland Summer Time |
| Lat & Lng | 65.57529, -37.18606 |
| Postal Codes | 3915 |
Map of Kulusuk
Interactive Map
Kulusuk Population
Years 1975 to 2015
| Data | 1975 | 1990 | 2000 | 2015 |
|---|---|---|---|---|
| Population | 33 | 58 | 52 | 41 |
| Population Density | 9.1 / km² | 16 / km² | 14.3 / km² | 11.3 / km² |
Kulusuk Population change from 2000 to 2015
Decrease of 21.2% from year 2000 to 2015
| Location | Change since 1975 | Change since 1990 | Change since 2000 |
|---|---|---|---|
| Kulusuk | +24.2% | -29.3% | -21.2% |
| Sermersooq | +364.8% | +155% | +9.2% |
| Greenland | -6.7% | +16.2% | +0.2% |
Kulusuk Median Age
Median Age: 34.3 years
| Location | Median Age | Median Age (Female) | Median Age (Male) |
|---|---|---|---|
| Kulusuk | 34.3 yrs | 28.1 yrs | 40.2 yrs |
| Sermersooq | 33.9 yrs | 32.6 yrs | 35.1 yrs |
| Greenland | 33.6 yrs | 32.1 yrs | 35 yrs |
Kulusuk Population Density
Population Density: 11.3 / km²
| Location | Population | Area | Density |
|---|---|---|---|
| Kulusuk | 41 | 3.625 km² | 11.3 / km² |
| Sermersooq | 11,370 | 546,450.6 km² | 0 / km² |
| Greenland | 34,483 | 2,165,628.3 km² | 0 / km² |
Kulusuk Historical and Projected Population
Estimated Population from 1975 to 2015
- JRC (European Commission's Joint Research Centre) work on the GHS built-up grid
- CIESIN (Center for International Earth Science Information Network)
- [Link] Klein Goldewijk, K., Beusen, A., Doelman, J., and Stehfest, E.: Anthropogenic land use estimates for the Holocene – HYDE 3.2, Earth Syst. Sci. Data, 9, 927–953, https://doi.org/10.5194/essd-9-927-2017, 2017.
Human Development Index (HDI)
Statistic composite index of life expectancy, education, and per capita income.
Kulusuk CO2 Emissions
Carbon Dioxide (CO2) Emissions Per Capita in Tonnes Per Year
| Location | CO2 Emissions | CO2 Emissions Per Capita | CO2 Emissions Intensity |
|---|---|---|---|
| Kulusuk | 993 tn | 24.23 tn | 274 tons/km² |
| Sermersooq | 272,342 tn | 23.95 tn | 0.5 tons/km² |
| Greenland | 813,754 tn | 23.6 tn | 0.4 tons/km² |
| 2013 CO2 emissions (tonnes/year) | 993 tn |
| 2013 CO2 emissions (tonnes/year) per capita | 24.23 tn |
| 2013 CO2 emissions intensity (tonnes/km²/year) | 274 tons/km² |
Recent Nearby Earthquakes
Magnitude 3.0 and greater
| Date▼ | Time↕ | Magnitude↕ | Distance↕ | Depth↕ | Location↕ | Link |
|---|---|---|---|---|---|---|
| 1/13/19 | 12:32 PM | 4.4 | 39.4 km | 10,000 m | 34km NNE of Tasiilaq, Greenland | usgs.gov |
| 4/25/08 | 7:39 AM | 4.1 | 33.4 km | 10,000 m | eastern Greenland | usgs.gov |
| 9/8/04 | 1:28 PM | 4.2 | 97.7 km | 10,000 m | eastern Greenland | usgs.gov |
| 5/1/93 | 12:01 PM | 4 | 59.7 km | 10,000 m | eastern Greenland | usgs.gov |
| 1/13/91 | 5:22 PM | 4.8 | 22.2 km | 10,000 m | eastern Greenland | usgs.gov |
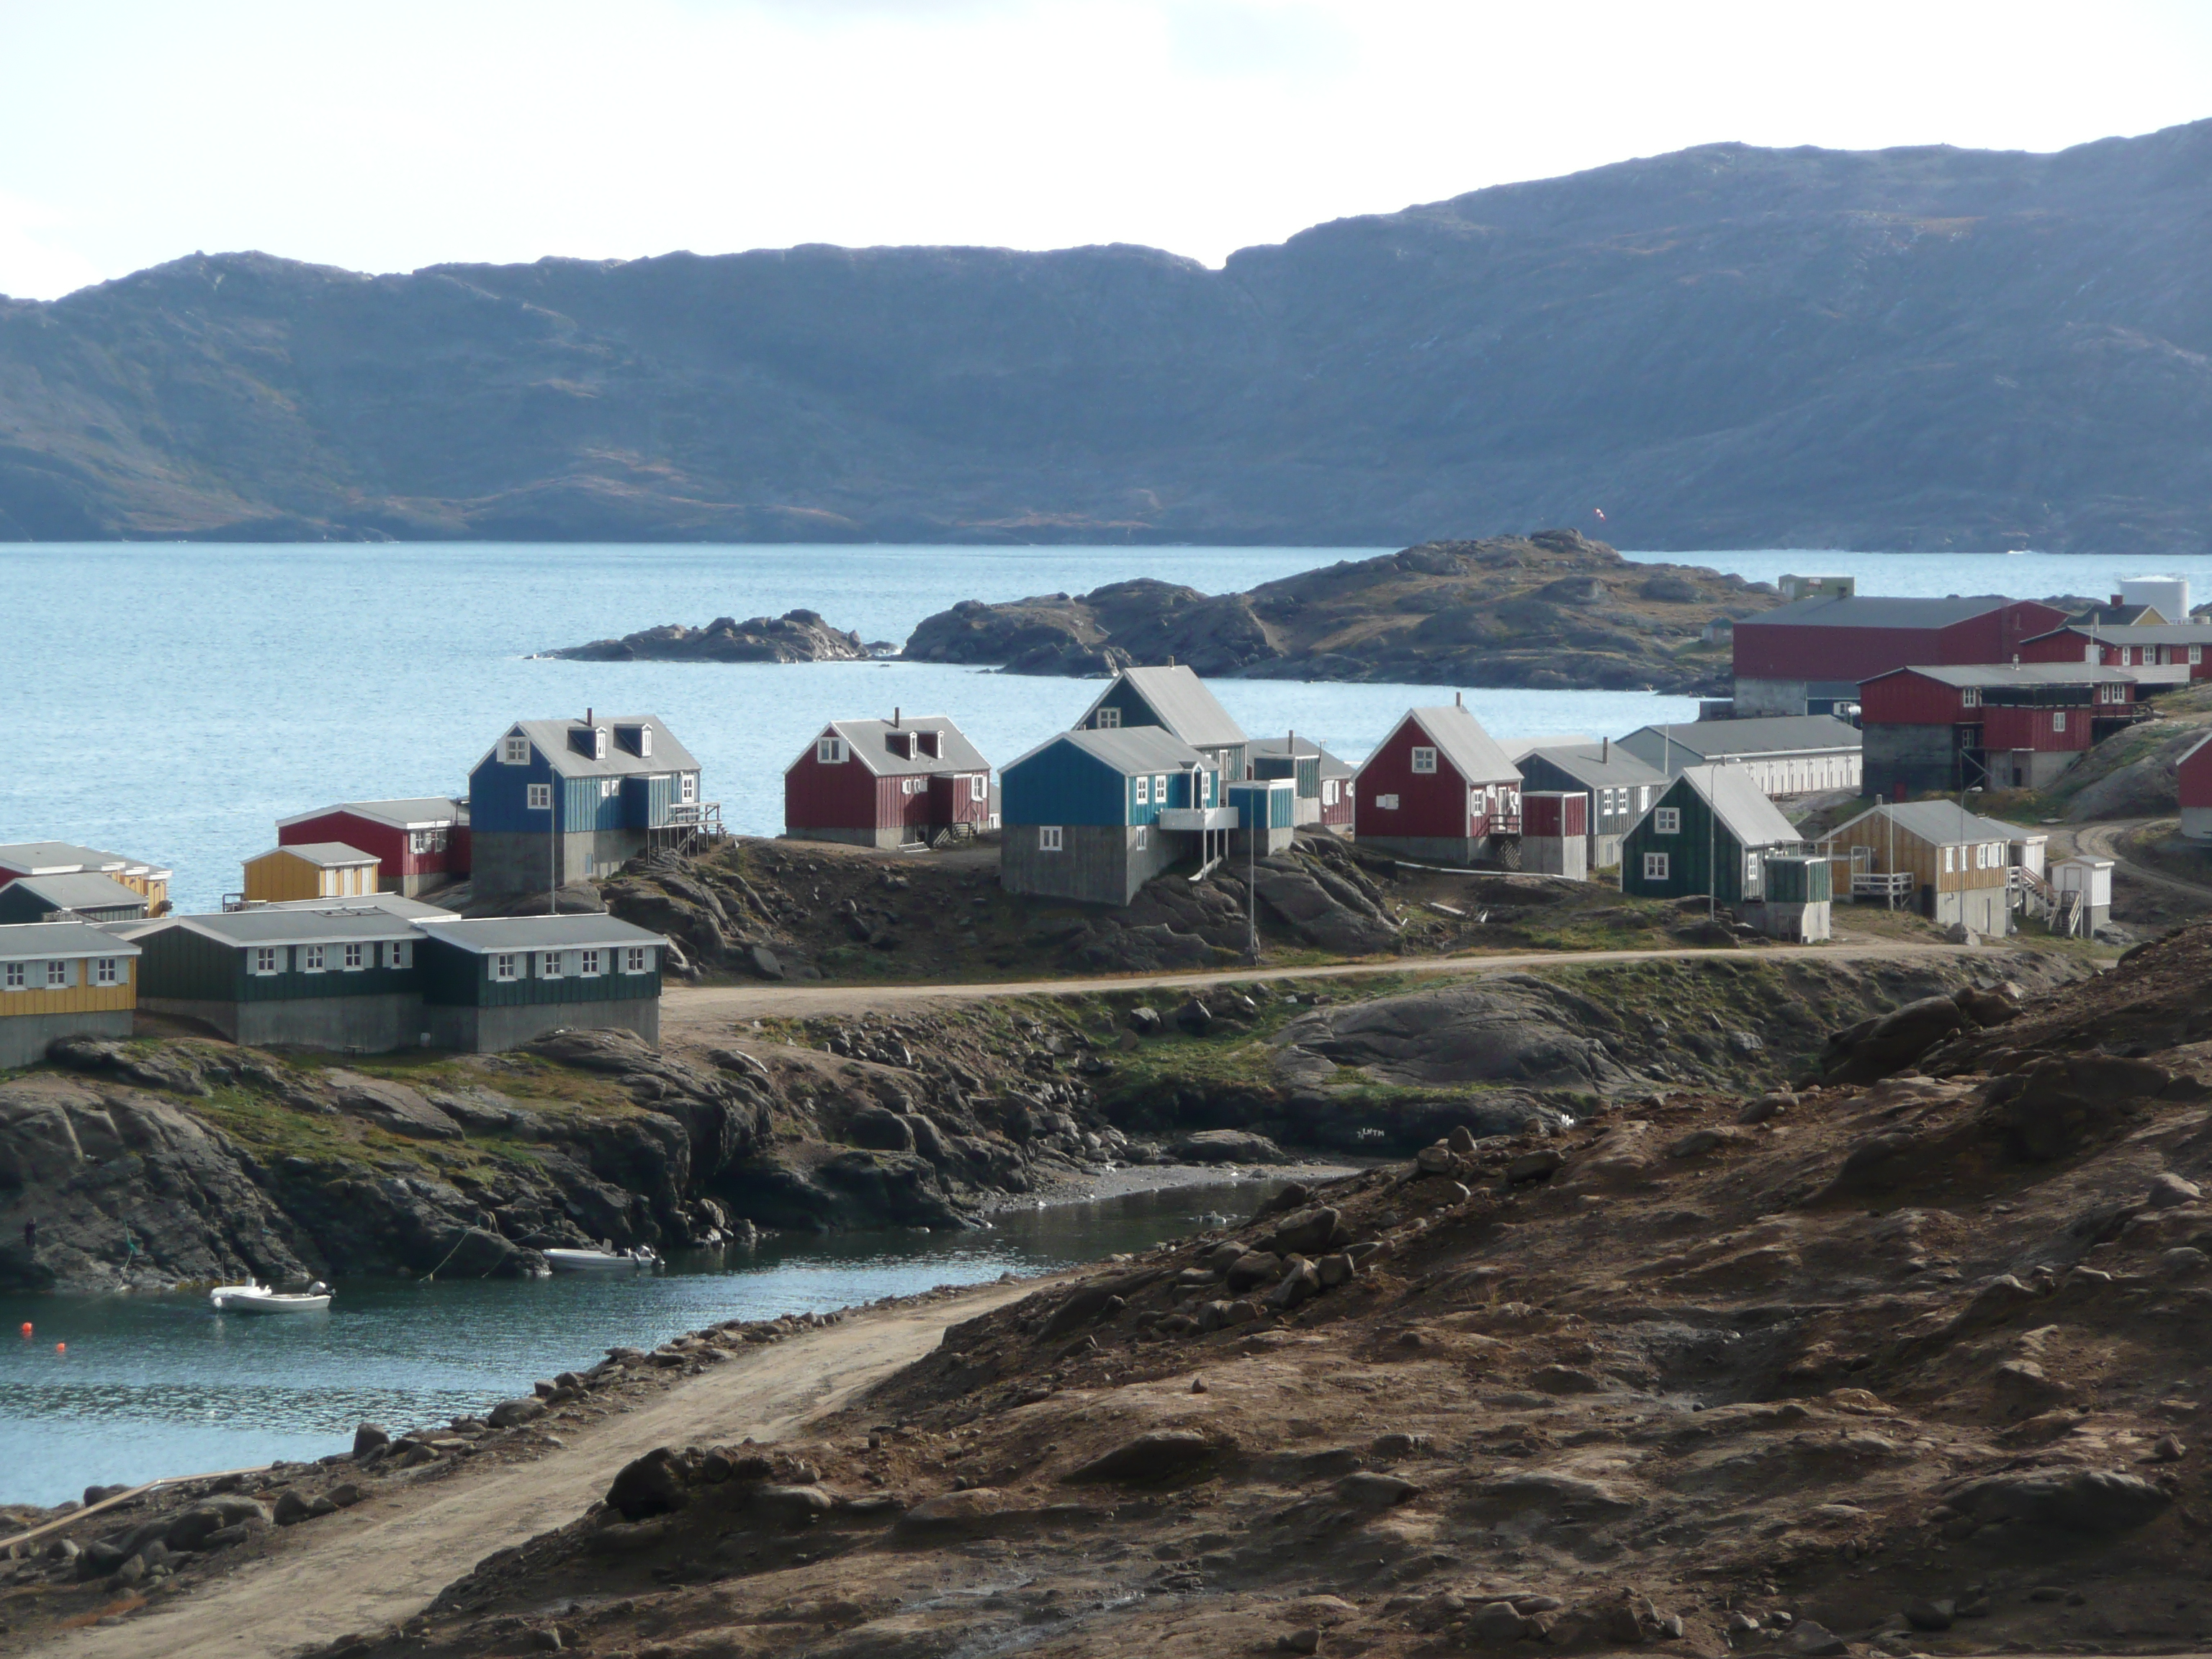
Kulusuk
Kulusuk (old spelling: Qulusuk), formerly Kap Dan, is a settlement in the Sermersooq municipality in southeastern Greenland, located on an island of the same name. The settlement population of 267 is quite uncommon for an Inuit settlement in Greenlan..
Kulusuk Wikipedia Page


About Our Data
The data on this page is estimated using a number of publicly available tools and resources. It is provided without warranty, and could contain inaccuracies. Use at your own risk.