Naajaat Facts
| Area | 2.3 km² |
| Population | 49 |
| Male Population | 28 (58.0%) |
| Female Population | 21 (42.0%) |
| Population change (1975 to 2015) | +96.0% |
| Population change (2000 to 2015) | -7.5% |
| Median Age | 35.8 years (Male: 27.5, Female: 38.8) |
| Local Time | |
| Timezone | Greenland Summer Time |
| Lat & Lng | 73.15000, -55.81667 |
Map of Naajaat
Interactive Map
Naajaat Population
Years 1975 to 2015
| Data | 1975 | 1990 | 2000 | 2015 |
|---|---|---|---|---|
| Population | 25 | 53 | 53 | 49 |
| Population Density | 11.1 / km² | 23.6 / km² | 23.6 / km² | 21.8 / km² |
Naajaat Population change from 2000 to 2015
Decrease of 7.5% from year 2000 to 2015
| Location | Change since 1975 | Change since 1990 | Change since 2000 |
|---|---|---|---|
| Naajaat | +96% | -7.5% | -7.5% |
| Qaasuitsup | -58.8% | -14% | -7.8% |
| Greenland | -6.7% | +16.2% | +0.2% |
Naajaat Median Age
Median Age: 35.8 years
| Location | Median Age | Median Age (Female) | Median Age (Male) |
|---|---|---|---|
| Naajaat | 35.8 yrs | 38.8 yrs | 27.5 yrs |
| Qaasuitsup | 32.9 yrs | 31 yrs | 34.6 yrs |
| Greenland | 33.6 yrs | 32.1 yrs | 35 yrs |
Naajaat Population Density
Population Density: 21.8 / km²
| Location | Population | Area | Density |
|---|---|---|---|
| Naajaat | 49 | 2.25 km² | 21.8 / km² |
| Qaasuitsup | 12,104 | 576,067.4 km² | 0 / km² |
| Greenland | 34,483 | 2,165,628.3 km² | 0 / km² |
Naajaat Historical and Projected Population
Estimated Population from 1975 to 2015
- JRC (European Commission's Joint Research Centre) work on the GHS built-up grid
- CIESIN (Center for International Earth Science Information Network)
- [Link] Klein Goldewijk, K., Beusen, A., Doelman, J., and Stehfest, E.: Anthropogenic land use estimates for the Holocene – HYDE 3.2, Earth Syst. Sci. Data, 9, 927–953, https://doi.org/10.5194/essd-9-927-2017, 2017.
Human Development Index (HDI)
Statistic composite index of life expectancy, education, and per capita income.
Qaasuitsup CO2 Emissions
Carbon Dioxide (CO2) Emissions Per Capita in Tonnes Per Year
| Location | CO2 Emissions | CO2 Emissions Per Capita | CO2 Emissions Intensity |
|---|---|---|---|
| Qaasuitsup | 290,830 tn | 24.03 tn | 0.5 tons/km² |
| Greenland | 813,754 tn | 23.6 tn | 0.4 tons/km² |
| 2013 CO2 emissions (tonnes/year) | 290,830 tn |
| 2013 CO2 emissions (tonnes/year) per capita | 24.03 tn |
| 2013 CO2 emissions intensity (tonnes/km²/year) | 0.5 tons/km² |
Natural Hazards Risk
Relative risk out of 10
| Hazard | Risk Level |
|---|---|
| Earthquake | Low (2) |
* Risk, particularly concerning flood or landslide, may not be for the entire area.
- Dilley, M., R.S. Chen, U. Deichmann, A.L. Lerner-Lam, M. Arnold, J. Agwe, P. Buys, O. Kjekstad, B. Lyon, and G. Yetman. 2005. Natural Disaster Hotspots: A Global Risk Analysis. Washington, D.C.: World Bank. https://doi.org/10.1596/0-8213-5930-4.
- Center for Hazards and Risk Research - CHRR - Columbia University, Center for International Earth Science Information Network - CIESIN - Columbia University. 2005. Global Earthquake Hazard Distribution - Peak Ground Acceleration. Palisades, NY: NASA Socioeconomic Data and Applications Center (SEDAC). https://doi.org/10.7927/H4BZ63ZS.
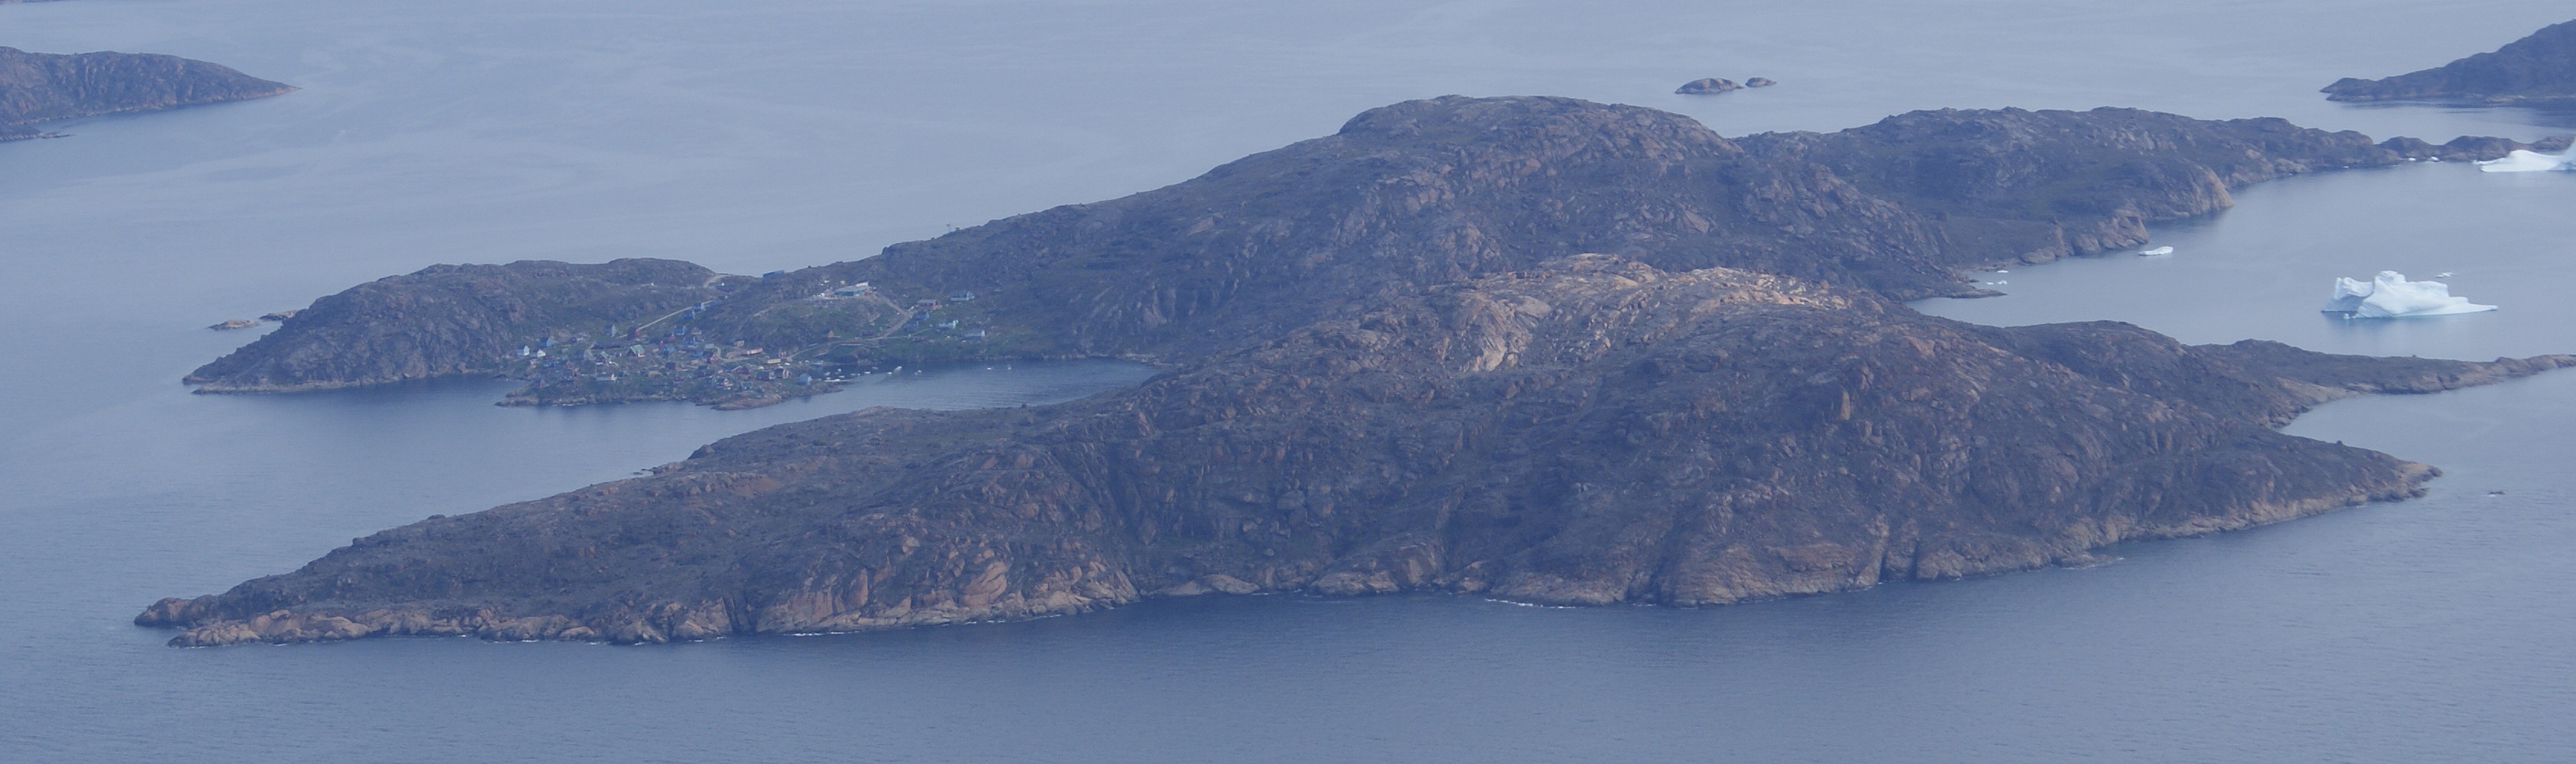
Naajaat
Naajaat (Kalaallisut: "Seagulls") is a settlement in the Qaasuitsup municipality in northwestern Greenland. Former spellings include Naujât, Naujat, and Naajat. Located on a small island of the same name, the settlement has 54 inhabitants as of July ..
Naajaat Wikipedia Page


About Our Data
The data on this page is estimated using a number of publicly available tools and resources. It is provided without warranty, and could contain inaccuracies. Use at your own risk.