Categories in Kolymvari
Industries
Business Distribution by Industry in Kolymvari
| Industry Description | Number of Establishments |
|---|---|
| Other accommodation | 109 |
| Churches | 52 |
| Restaurants | 49 |
| Hotels and motels | 41 |
| Holiday homes, cabins and resorts | 27 |
| Real estate | 23 |
| Religion | 23 |
| Cafes | 17 |
| Cemeteries and crematoriums | 15 |
| Atm's | 13 |
| Grocery stores and supermarkets | 11 |
| Shopping | 11 |
| Car rental | 10 |
| All food and beverage | 10 |
Kolymvari Facts
| Area | 148.8 km² |
| Population | 4,485 |
| Male Population | 2,272 (50.7%) |
| Female Population | 2,213 (49.3%) |
| Population change (1975 to 2020) | +50.1% |
| Population change (2000 to 2020) | +6.7% |
| Median Age | 46.1 years (Male: 44.2, Female: 48.1) |
| Neighborhoods | Skoutelonas |
| Local Time | |
| Timezone | Eastern European Summer Time |
| Lat & Lng | 35.54115, 23.77995 |
| Postal Codes | 730 06 |
Map of Kolymvari
Interactive Map
Kolymvari Population
Years 1975 to 2020
| Data | 1975 | 1990 | 2000 | 2015 | 2020 |
|---|---|---|---|---|---|
| Population | 2,988 | 3,665 | 4,202 | 4,578 | 4,485 |
| Population Density | 20.1 / km² | 24.6 / km² | 28.2 / km² | 30.8 / km² | 30.2 / km² |
Kolymvari Population change from 2000 to 2015
Increase of 8.9% from year 2000 to 2015
| Location | Change since 1975 | Change since 1990 | Change since 2000 |
|---|---|---|---|
| Kolymvari | +53.2% | +24.9% | +8.9% |
| Crete | +53.4% | +25.1% | +9.1% |
| Greece | +21.3% | +8.1% | +0% |
Kolymvari Median Age
Median Age: 46.1 years
| Location | Median Age | Median Age (Female) | Median Age (Male) |
|---|---|---|---|
| Kolymvari | 46.1 yrs | 48.1 yrs | 44.2 yrs |
| Crete | 39.2 yrs | 40.1 yrs | 38.2 yrs |
| Greece | 41.8 yrs | 43.1 yrs | 40.5 yrs |
Kolymvari Population Density
Population Density: 30.2 / km²
| Location | Population | Area | Density |
|---|---|---|---|
| Kolymvari | 4,485 | 148.8 km² | 30.2 / km² |
| Crete | 618,444 | 8,365.9 km² | 73.9 / km² |
| Greece | 10.7 million | 132,689.5 km² | 80.4 / km² |
Kolymvari Historical and Projected Population
Estimated Population from 0 to 2100
- JRC (European Commission's Joint Research Centre) work on the GHS built-up grid
- CIESIN (Center for International Earth Science Information Network)
- [Link] Klein Goldewijk, K., Beusen, A., Doelman, J., and Stehfest, E.: Anthropogenic land use estimates for the Holocene – HYDE 3.2, Earth Syst. Sci. Data, 9, 927–953, https://doi.org/10.5194/essd-9-927-2017, 2017.
Area Codes
Percentage Area Codes used by businesses in Kolymvari
Postal Codes
Percentage of businesses by Postal Codes in Kolymvari
Price Distribution
Business distribution by price for Kolymvari
Human Development Index (HDI)
Statistic composite index of life expectancy, education, and per capita income.
Kolymvari CO2 Emissions
Carbon Dioxide (CO2) Emissions Per Capita in Tonnes Per Year
| Location | CO2 Emissions | CO2 Emissions Per Capita | CO2 Emissions Intensity |
|---|---|---|---|
| Kolymvari | 44,233 tn | 9.86 tn | 297.4 tons/km² |
| Crete | 5,917,901 tn | 9.57 tn | 707.4 tons/km² |
| Greece | 105,407,278 tn | 9.89 tn | 794.4 tons/km² |
| 2013 CO2 emissions (tonnes/year) | 44,233 tn |
| 2013 CO2 emissions (tonnes/year) per capita | 9.86 tn |
| 2013 CO2 emissions intensity (tonnes/km²/year) | 297.4 tons/km² |
Natural Hazards Risk
Relative risk out of 10
| Hazard | Risk Level |
|---|---|
| Earthquake | Medium (6.9) |
| Landslide | Medium (6) |
* Risk, particularly concerning flood or landslide, may not be for the entire area.
- Dilley, M., R.S. Chen, U. Deichmann, A.L. Lerner-Lam, M. Arnold, J. Agwe, P. Buys, O. Kjekstad, B. Lyon, and G. Yetman. 2005. Natural Disaster Hotspots: A Global Risk Analysis. Washington, D.C.: World Bank. https://doi.org/10.1596/0-8213-5930-4.
- Center for Hazards and Risk Research - CHRR - Columbia University, Center for International Earth Science Information Network - CIESIN - Columbia University, and Norwegian Geotechnical Institute - NGI. 2005. Global Landslide Hazard Distribution. Palisades, NY: NASA Socioeconomic Data and Applications Center (SEDAC). https://doi.org/10.7927/H4P848VZ.
- Center for Hazards and Risk Research - CHRR - Columbia University, Center for International Earth Science Information Network - CIESIN - Columbia University. 2005. Global Earthquake Hazard Distribution - Peak Ground Acceleration. Palisades, NY: NASA Socioeconomic Data and Applications Center (SEDAC). https://doi.org/10.7927/H4BZ63ZS.
Recent Nearby Earthquakes
Magnitude 3.0 and greater
| Date▼ | Time↕ | Magnitude↕ | Distance↕ | Depth↕ | Location↕ | Link |
|---|---|---|---|---|---|---|
| 1/7/19 | 1:41 PM | 4 | 25.3 km | 10,000 m | 23km NNW of Kissamos, Greece | usgs.gov |
| 11/19/08 | 9:21 PM | 3.1 | 22.4 km | 54,000 m | Crete, Greece | usgs.gov |
| 8/25/08 | 10:52 PM | 3.4 | 11.5 km | 30,000 m | Crete, Greece | usgs.gov |
| 7/14/08 | 11:24 AM | 3.3 | 25.6 km | 14,000 m | Crete, Greece | usgs.gov |
| 6/18/08 | 12:11 PM | 3.1 | 25.7 km | 16,000 m | Crete, Greece | usgs.gov |
| 5/3/08 | 9:14 PM | 3.4 | 19.5 km | 12,000 m | Crete, Greece | usgs.gov |
| 4/21/08 | 11:43 AM | 3.3 | 11.4 km | 27,000 m | Crete, Greece | usgs.gov |
| 3/16/08 | 5:21 AM | 3.6 | 23.2 km | 24,000 m | Crete, Greece | usgs.gov |
| 2/27/08 | 9:02 AM | 4 | 22.1 km | 34,000 m | Crete, Greece | usgs.gov |
| 2/18/08 | 2:46 PM | 3.6 | 20.4 km | 20,000 m | Crete, Greece | usgs.gov |
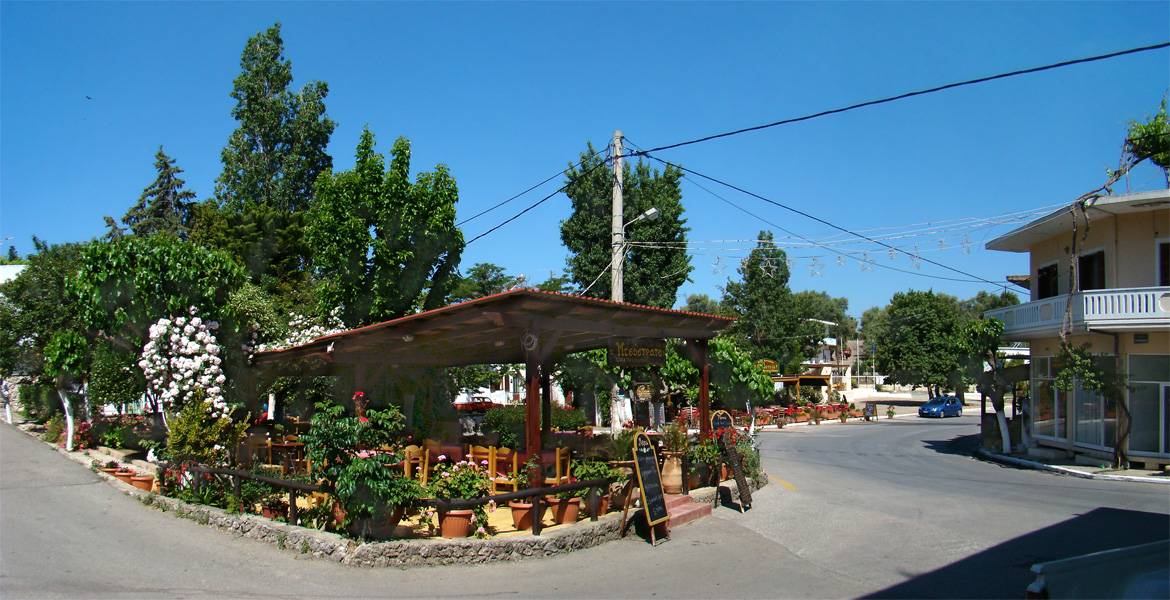
Kolymvari
Kolymvari (Greek: Κολυμβάρι, Δήμος Κολυμβαρίου), also known as Kolymbari (Greek: Κολυμπάρι), is a town and former municipality in the Chania regional unit, Crete, Greece. Since the 2011 local government reform it is part of the municipality Platanias..
Kolymvari Wikipedia Page

About Our Data
The data on this page is estimated using a number of publicly available tools and resources. It is provided without warranty, and could contain inaccuracies. Use at your own risk.