Industries
Business Distribution by Industry in Lechaio
| Industry Description | Number of Establishments |
|---|---|
| Restaurants | 16 |
| Cafes | 12 |
| Car repair | 9 |
| Other accommodation | 9 |
| All food and beverage | 7 |
| Grocery stores and supermarkets | 6 |
| Hotels and motels | 5 |
| Education | 5 |
| Shopping | 5 |
Lechaio Facts
| Area | 2.1 km² |
| Population | 1,824 |
| Male Population | 916 (50.2%) |
| Female Population | 908 (49.8%) |
| Population change (1975 to 2020) | +11.1% |
| Population change (2000 to 2020) | -3.8% |
| Median Age | 40.3 years (Male: 38.8, Female: 41.9) |
| Local Time | |
| Timezone | Eastern European Summer Time |
| Lat & Lng | 37.93279, 22.85002 |
| Postal Codes | 200 11 |
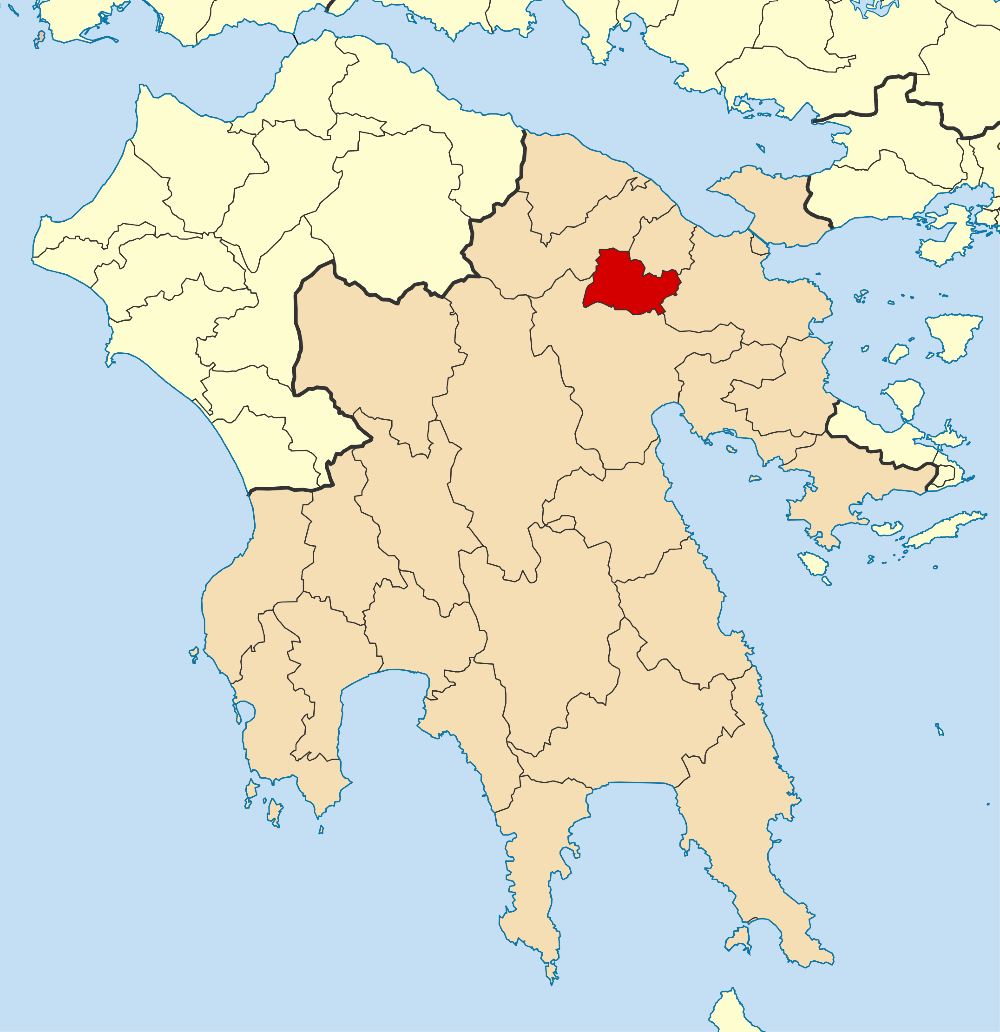
Map of Lechaio
Interactive Map
Lechaio Population
Years 1975 to 2020
| Data | 1975 | 1990 | 2000 | 2015 | 2020 |
|---|---|---|---|---|---|
| Population | 1,642 | 1,811 | 1,896 | 1,798 | 1,824 |
| Population Density | 796.1 / km² | 878.1 / km² | 919.3 / km² | 871.8 / km² | 884.4 / km² |
Lechaio Population change from 2000 to 2015
Decrease of 5.2% from year 2000 to 2015
| Location | Change since 1975 | Change since 1990 | Change since 2000 |
|---|---|---|---|
| Lechaio | +9.5% | -0.7% | -5.2% |
| Peloponnese (region) | +11.6% | +2.4% | -3.2% |
| Greece | +21.3% | +8.1% | +0% |
Lechaio Median Age
Median Age: 40.3 years
| Location | Median Age | Median Age (Female) | Median Age (Male) |
|---|---|---|---|
| Lechaio | 40.3 yrs | 41.9 yrs | 38.8 yrs |
| Peloponnese (region) | 44.3 yrs | 45.6 yrs | 43.1 yrs |
| Greece | 41.8 yrs | 43.1 yrs | 40.5 yrs |
Lechaio Population Density
Population Density: 884 / km²
| Location | Population | Area | Density |
|---|---|---|---|
| Lechaio | 1,824 | 2.063 km² | 884 / km² |
| Peloponnese (region) | 556,287 | 15,539.5 km² | 35.8 / km² |
| Greece | 10.7 million | 132,689.5 km² | 80.4 / km² |
Lechaio Historical and Projected Population
Estimated Population from 0 to 2100
- JRC (European Commission's Joint Research Centre) work on the GHS built-up grid
- CIESIN (Center for International Earth Science Information Network)
- [Link] Klein Goldewijk, K., Beusen, A., Doelman, J., and Stehfest, E.: Anthropogenic land use estimates for the Holocene – HYDE 3.2, Earth Syst. Sci. Data, 9, 927–953, https://doi.org/10.5194/essd-9-927-2017, 2017.
Area Codes
Percentage Area Codes used by businesses in Lechaio
Price Distribution
Business distribution by price for Lechaio
Human Development Index (HDI)
Statistic composite index of life expectancy, education, and per capita income.
Lechaio CO2 Emissions
Carbon Dioxide (CO2) Emissions Per Capita in Tonnes Per Year
| Location | CO2 Emissions | CO2 Emissions Per Capita | CO2 Emissions Intensity |
|---|---|---|---|
| Lechaio | 17,404 tn | 9.54 tn | 8,438.3 tons/km² |
| Peloponnese (region) | 4,960,727 tn | 8.92 tn | 319.2 tons/km² |
| Greece | 105,407,278 tn | 9.89 tn | 794.4 tons/km² |
| 2013 CO2 emissions (tonnes/year) | 17,404 tn |
| 2013 CO2 emissions (tonnes/year) per capita | 9.54 tn |
| 2013 CO2 emissions intensity (tonnes/km²/year) | 8,438.3 tons/km² |
Natural Hazards Risk
Relative risk out of 10
| Hazard | Risk Level |
|---|---|
| Drought | Medium (7) |
| Earthquake | Medium (7) |
* Risk, particularly concerning flood or landslide, may not be for the entire area.
- Dilley, M., R.S. Chen, U. Deichmann, A.L. Lerner-Lam, M. Arnold, J. Agwe, P. Buys, O. Kjekstad, B. Lyon, and G. Yetman. 2005. Natural Disaster Hotspots: A Global Risk Analysis. Washington, D.C.: World Bank. https://doi.org/10.1596/0-8213-5930-4.
- Center for Hazards and Risk Research - CHRR - Columbia University, Center for International Earth Science Information Network - CIESIN - Columbia University, and International Research Institute for Climate and Society - IRI - Columbia University. 2005. Global Drought Hazard Frequency and Distribution. Palisades, NY: NASA Socioeconomic Data and Applications Center (SEDAC). https://doi.org/10.7927/H4VX0DFT.
- Center for Hazards and Risk Research - CHRR - Columbia University, Center for International Earth Science Information Network - CIESIN - Columbia University. 2005. Global Earthquake Hazard Distribution - Peak Ground Acceleration. Palisades, NY: NASA Socioeconomic Data and Applications Center (SEDAC). https://doi.org/10.7927/H4BZ63ZS.
Recent Nearby Earthquakes
Magnitude 3.0 and greater
| Date▼ | Time↕ | Magnitude↕ | Distance↕ | Depth↕ | Location↕ | Link |
|---|---|---|---|---|---|---|
| 8/3/19 | 5:17 PM | 4.1 | 20.4 km | 38,490 m | 9km NNW of Perakhora, Greece | usgs.gov |
| 10/9/17 | 1:19 AM | 4.1 | 6 km | 10,000 m | 5km WNW of Corinth, Greece | usgs.gov |
| 9/20/17 | 8:40 AM | 4.4 | 18.4 km | 35,410 m | 6km N of Nemea, Greece | usgs.gov |
| 9/22/12 | 3:52 AM | 5 | 19.8 km | 10,000 m | Greece | usgs.gov |
| 2/17/12 | 8:05 AM | 4.6 | 16.5 km | 17,000 m | southern Greece | usgs.gov |
| 12/14/10 | 1:58 PM | 4.1 | 16 km | 5,000 m | Greece | usgs.gov |
| 5/9/09 | 1:46 AM | 4.4 | 16.2 km | 12,800 m | Greece | usgs.gov |
| 8/8/08 | 6:07 AM | 3 | 18.7 km | 30,000 m | southern Greece | usgs.gov |
| 7/13/08 | 9:47 PM | 3.3 | 9.7 km | 4,000 m | Greece | usgs.gov |
| 5/25/08 | 3:11 PM | 4.4 | 23.9 km | 21,300 m | Greece | usgs.gov |
Lechaio
Lechaio (Greek: Λέχαιο) is a village in the municipal unit of Assos-Lechaio in Corinthia, Greece. It is situated on the coast of the Gulf of Corinth, 8 km west of Corinth and 12 km southeast of Kiato. The Greek National Road 8 passes through the town..
Lechaio Wikipedia Page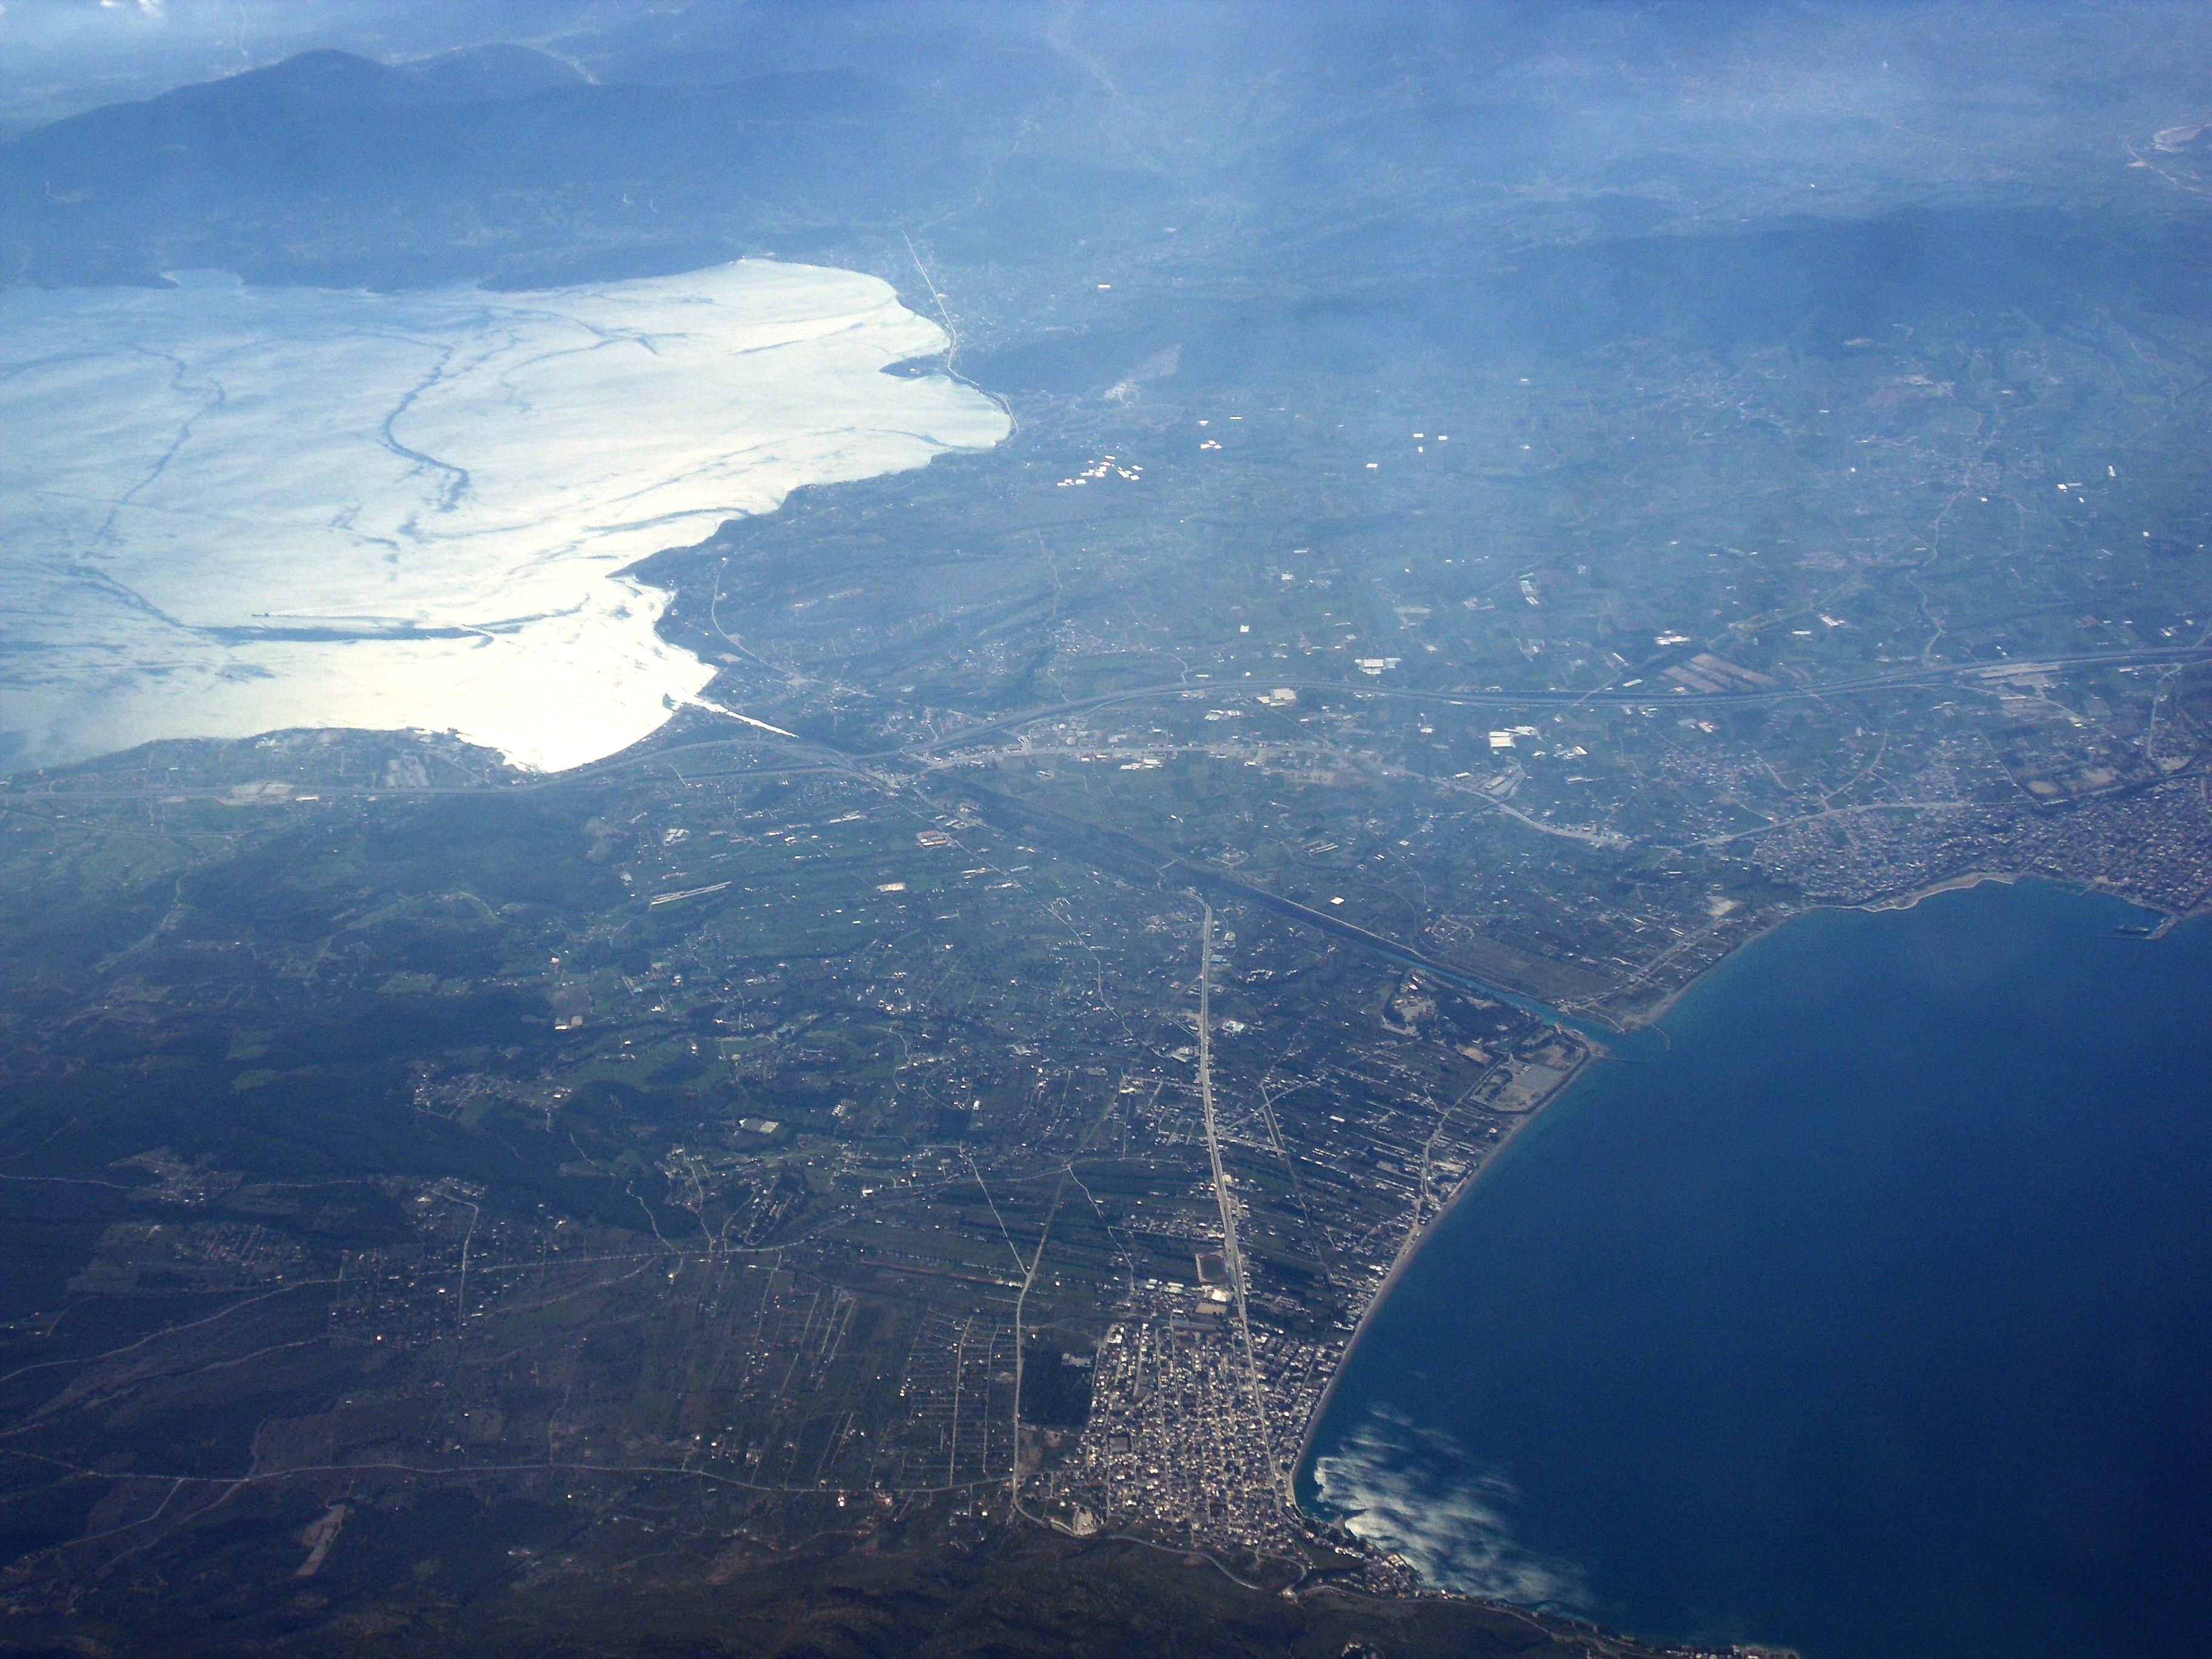

About Our Data
The data on this page is estimated using a number of publicly available tools and resources. It is provided without warranty, and could contain inaccuracies. Use at your own risk.