Industries
Business Distribution by Industry in Vonitsa
| Industry Description | Number of Establishments |
|---|---|
| Churches | 24 |
| Restaurants | 19 |
| Cafes | 11 |
| Other accommodation | 9 |
| Gas station | 9 |
| Grocery stores and supermarkets | 9 |
| Hotels and motels | 7 |
| Technical construction services | 7 |
| Travel agencies | 6 |
| Fast food restaurants | 5 |
| Hardware store | 5 |
Vonitsa Facts
| Area | 1.6 km² |
| Population | 3,259 |
| Male Population | 1,683 (51.7%) |
| Female Population | 1,576 (48.3%) |
| Population change (1975 to 2020) | -19.3% |
| Population change (2000 to 2020) | -19.1% |
| Median Age | 44.5 years (Male: 42.9, Female: 46.7) |
| Area Codes | 2643 |
| Neighborhoods | Paraliaki Vonitsas |
| Local Time | |
| Timezone | Eastern European Summer Time |
| Lat & Lng | 38.91639, 20.88639 |
Map of Vonitsa
Interactive Map
Vonitsa Population
Years 1975 to 2020
| Data | 1975 | 1990 | 2000 | 2015 | 2020 |
|---|---|---|---|---|---|
| Population | 4,038 | 4,135 | 4,026 | 3,361 | 3,259 |
| Population Density | 2,584.3 / km² | 2,646.4 / km² | 2,576.6 / km² | 2,151 / km² | 2,085.8 / km² |
Vonitsa Population change from 2000 to 2015
Decrease of 16.5% from year 2000 to 2015
| Location | Change since 1975 | Change since 1990 | Change since 2000 |
|---|---|---|---|
| Vonitsa | -16.8% | -18.7% | -16.5% |
| Greece | +21.3% | +8.1% | +0% |
Vonitsa Median Age
Median Age: 44.5 years
| Location | Median Age | Median Age (Female) | Median Age (Male) |
|---|---|---|---|
| Vonitsa | 44.5 yrs | 46.7 yrs | 42.9 yrs |
| Greece | 41.8 yrs | 43.1 yrs | 40.5 yrs |
Vonitsa Population Density
Population Density: 2,086 / km²
| Location | Population | Area | Density |
|---|---|---|---|
| Vonitsa | 3,259 | 1.563 km² | 2,086 / km² |
| Greece | 10.7 million | 132,689.5 km² | 80.4 / km² |
Vonitsa Historical and Projected Population
Estimated Population from 0 to 2100
- JRC (European Commission's Joint Research Centre) work on the GHS built-up grid
- CIESIN (Center for International Earth Science Information Network)
- [Link] Klein Goldewijk, K., Beusen, A., Doelman, J., and Stehfest, E.: Anthropogenic land use estimates for the Holocene – HYDE 3.2, Earth Syst. Sci. Data, 9, 927–953, https://doi.org/10.5194/essd-9-927-2017, 2017.
Area Codes
Percentage Area Codes used by businesses in Vonitsa
Price Distribution
Business distribution by price for Vonitsa
Human Development Index (HDI)
Statistic composite index of life expectancy, education, and per capita income.
Vonitsa CO2 Emissions
Carbon Dioxide (CO2) Emissions Per Capita in Tonnes Per Year
| Location | CO2 Emissions | CO2 Emissions Per Capita | CO2 Emissions Intensity |
|---|---|---|---|
| Vonitsa | 26,890 tn | 8.25 tn | 17,209.7 tons/km² |
| Greece | 105,407,278 tn | 9.89 tn | 794.4 tons/km² |
| 2013 CO2 emissions (tonnes/year) | 26,890 tn |
| 2013 CO2 emissions (tonnes/year) per capita | 8.25 tn |
| 2013 CO2 emissions intensity (tonnes/km²/year) | 17,209.7 tons/km² |
Natural Hazards Risk
Relative risk out of 10
| Hazard | Risk Level |
|---|---|
| Drought | High (8) |
| Earthquake | High (8) |
| Landslide | Medium (6) |
* Risk, particularly concerning flood or landslide, may not be for the entire area.
- Dilley, M., R.S. Chen, U. Deichmann, A.L. Lerner-Lam, M. Arnold, J. Agwe, P. Buys, O. Kjekstad, B. Lyon, and G. Yetman. 2005. Natural Disaster Hotspots: A Global Risk Analysis. Washington, D.C.: World Bank. https://doi.org/10.1596/0-8213-5930-4.
- Center for Hazards and Risk Research - CHRR - Columbia University, Center for International Earth Science Information Network - CIESIN - Columbia University, and Norwegian Geotechnical Institute - NGI. 2005. Global Landslide Hazard Distribution. Palisades, NY: NASA Socioeconomic Data and Applications Center (SEDAC). https://doi.org/10.7927/H4P848VZ.
- Center for Hazards and Risk Research - CHRR - Columbia University, Center for International Earth Science Information Network - CIESIN - Columbia University, and International Research Institute for Climate and Society - IRI - Columbia University. 2005. Global Drought Hazard Frequency and Distribution. Palisades, NY: NASA Socioeconomic Data and Applications Center (SEDAC). https://doi.org/10.7927/H4VX0DFT.
- Center for Hazards and Risk Research - CHRR - Columbia University, Center for International Earth Science Information Network - CIESIN - Columbia University. 2005. Global Earthquake Hazard Distribution - Peak Ground Acceleration. Palisades, NY: NASA Socioeconomic Data and Applications Center (SEDAC). https://doi.org/10.7927/H4BZ63ZS.
Recent Nearby Earthquakes
Magnitude 3.0 and greater
| Date▼ | Time↕ | Magnitude↕ | Distance↕ | Depth↕ | Location↕ | Link |
|---|---|---|---|---|---|---|
| 9/9/14 | 11:24 AM | 4.3 | 8.9 km | 25,300 m | 4km SE of Preveza, Greece | usgs.gov |
| 8/22/08 | 10:06 PM | 3.1 | 6.7 km | 34,000 m | Greece | usgs.gov |
| 8/19/08 | 8:01 PM | 3.1 | 9.4 km | 5,000 m | Greece | usgs.gov |
| 8/19/08 | 7:52 AM | 3.3 | 8.5 km | 9,000 m | Greece | usgs.gov |
| 5/17/08 | 8:31 AM | 3.2 | 15.4 km | 23,000 m | Greece | usgs.gov |
| 9/15/07 | 4:20 AM | 3.5 | 20.1 km | 11,000 m | Greece | usgs.gov |
| 6/23/07 | 6:14 AM | 3.2 | 18.3 km | 14,000 m | Greece | usgs.gov |
| 6/15/07 | 3:14 AM | 3.3 | 15.4 km | 20,000 m | Greece | usgs.gov |
| 6/15/07 | 2:43 AM | 3.3 | 16.9 km | 28,000 m | Greece | usgs.gov |
| 2/18/07 | 11:08 AM | 3.2 | 17.1 km | 30,000 m | Greece | usgs.gov |
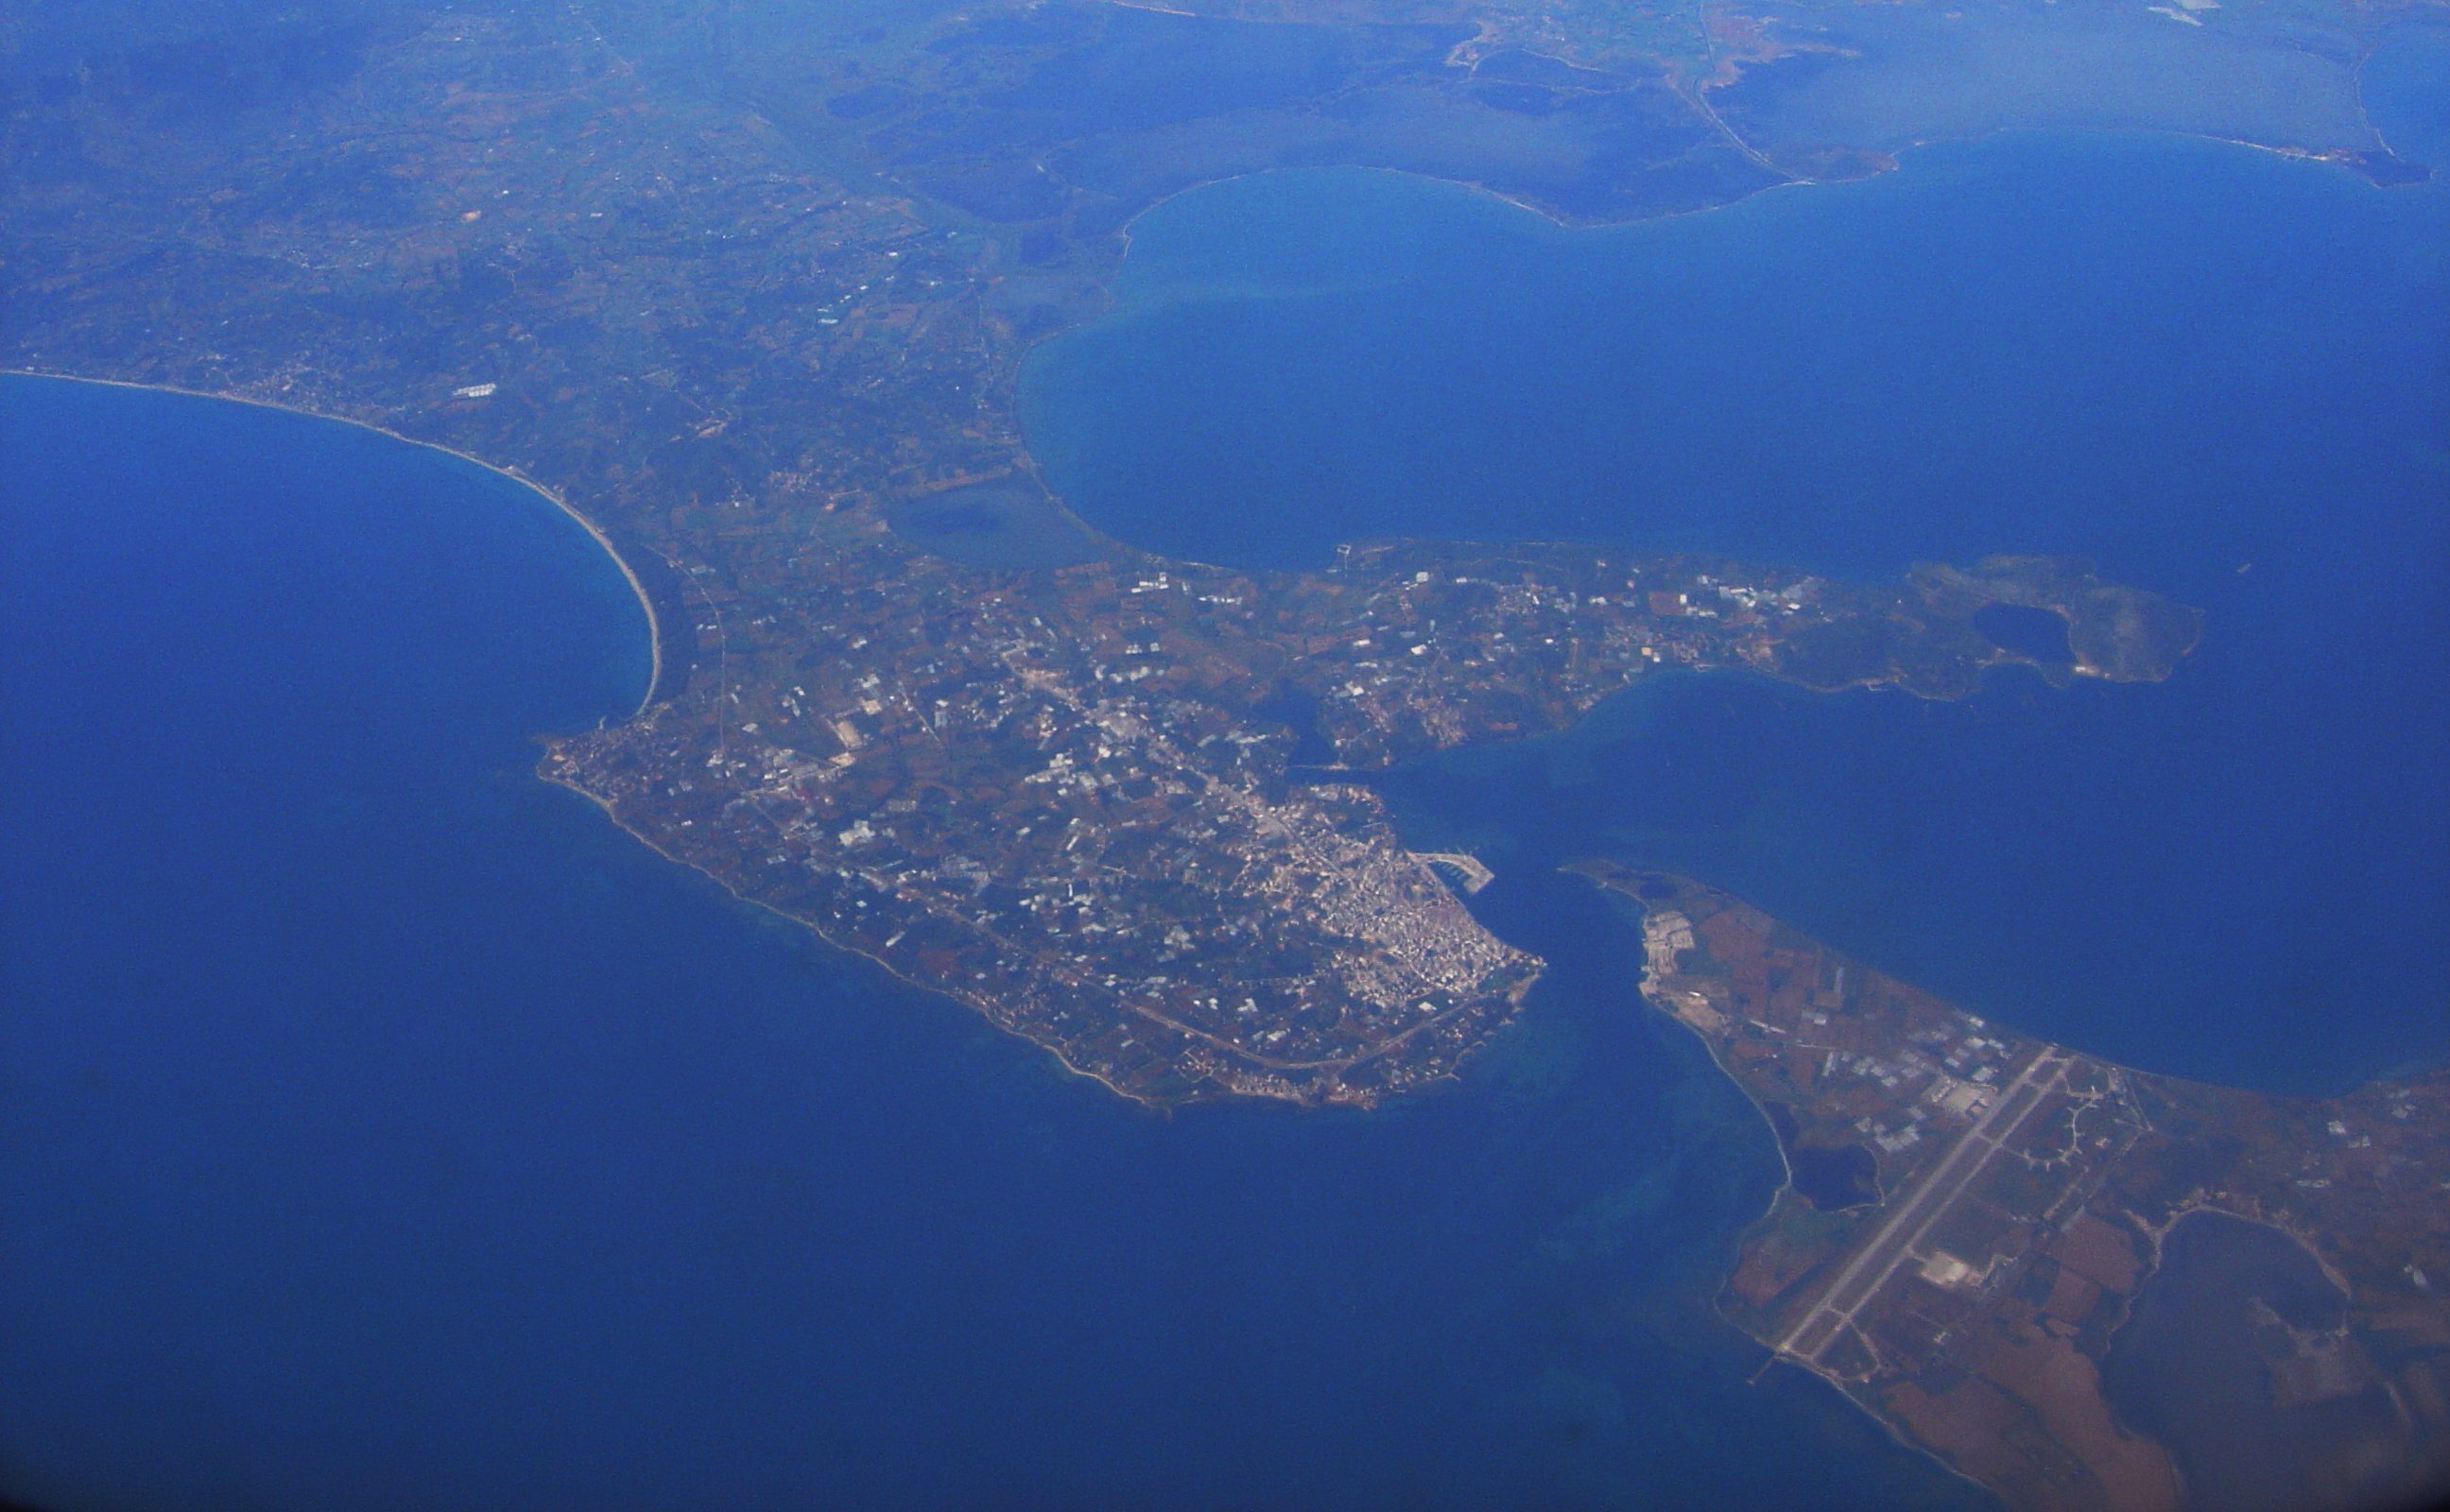
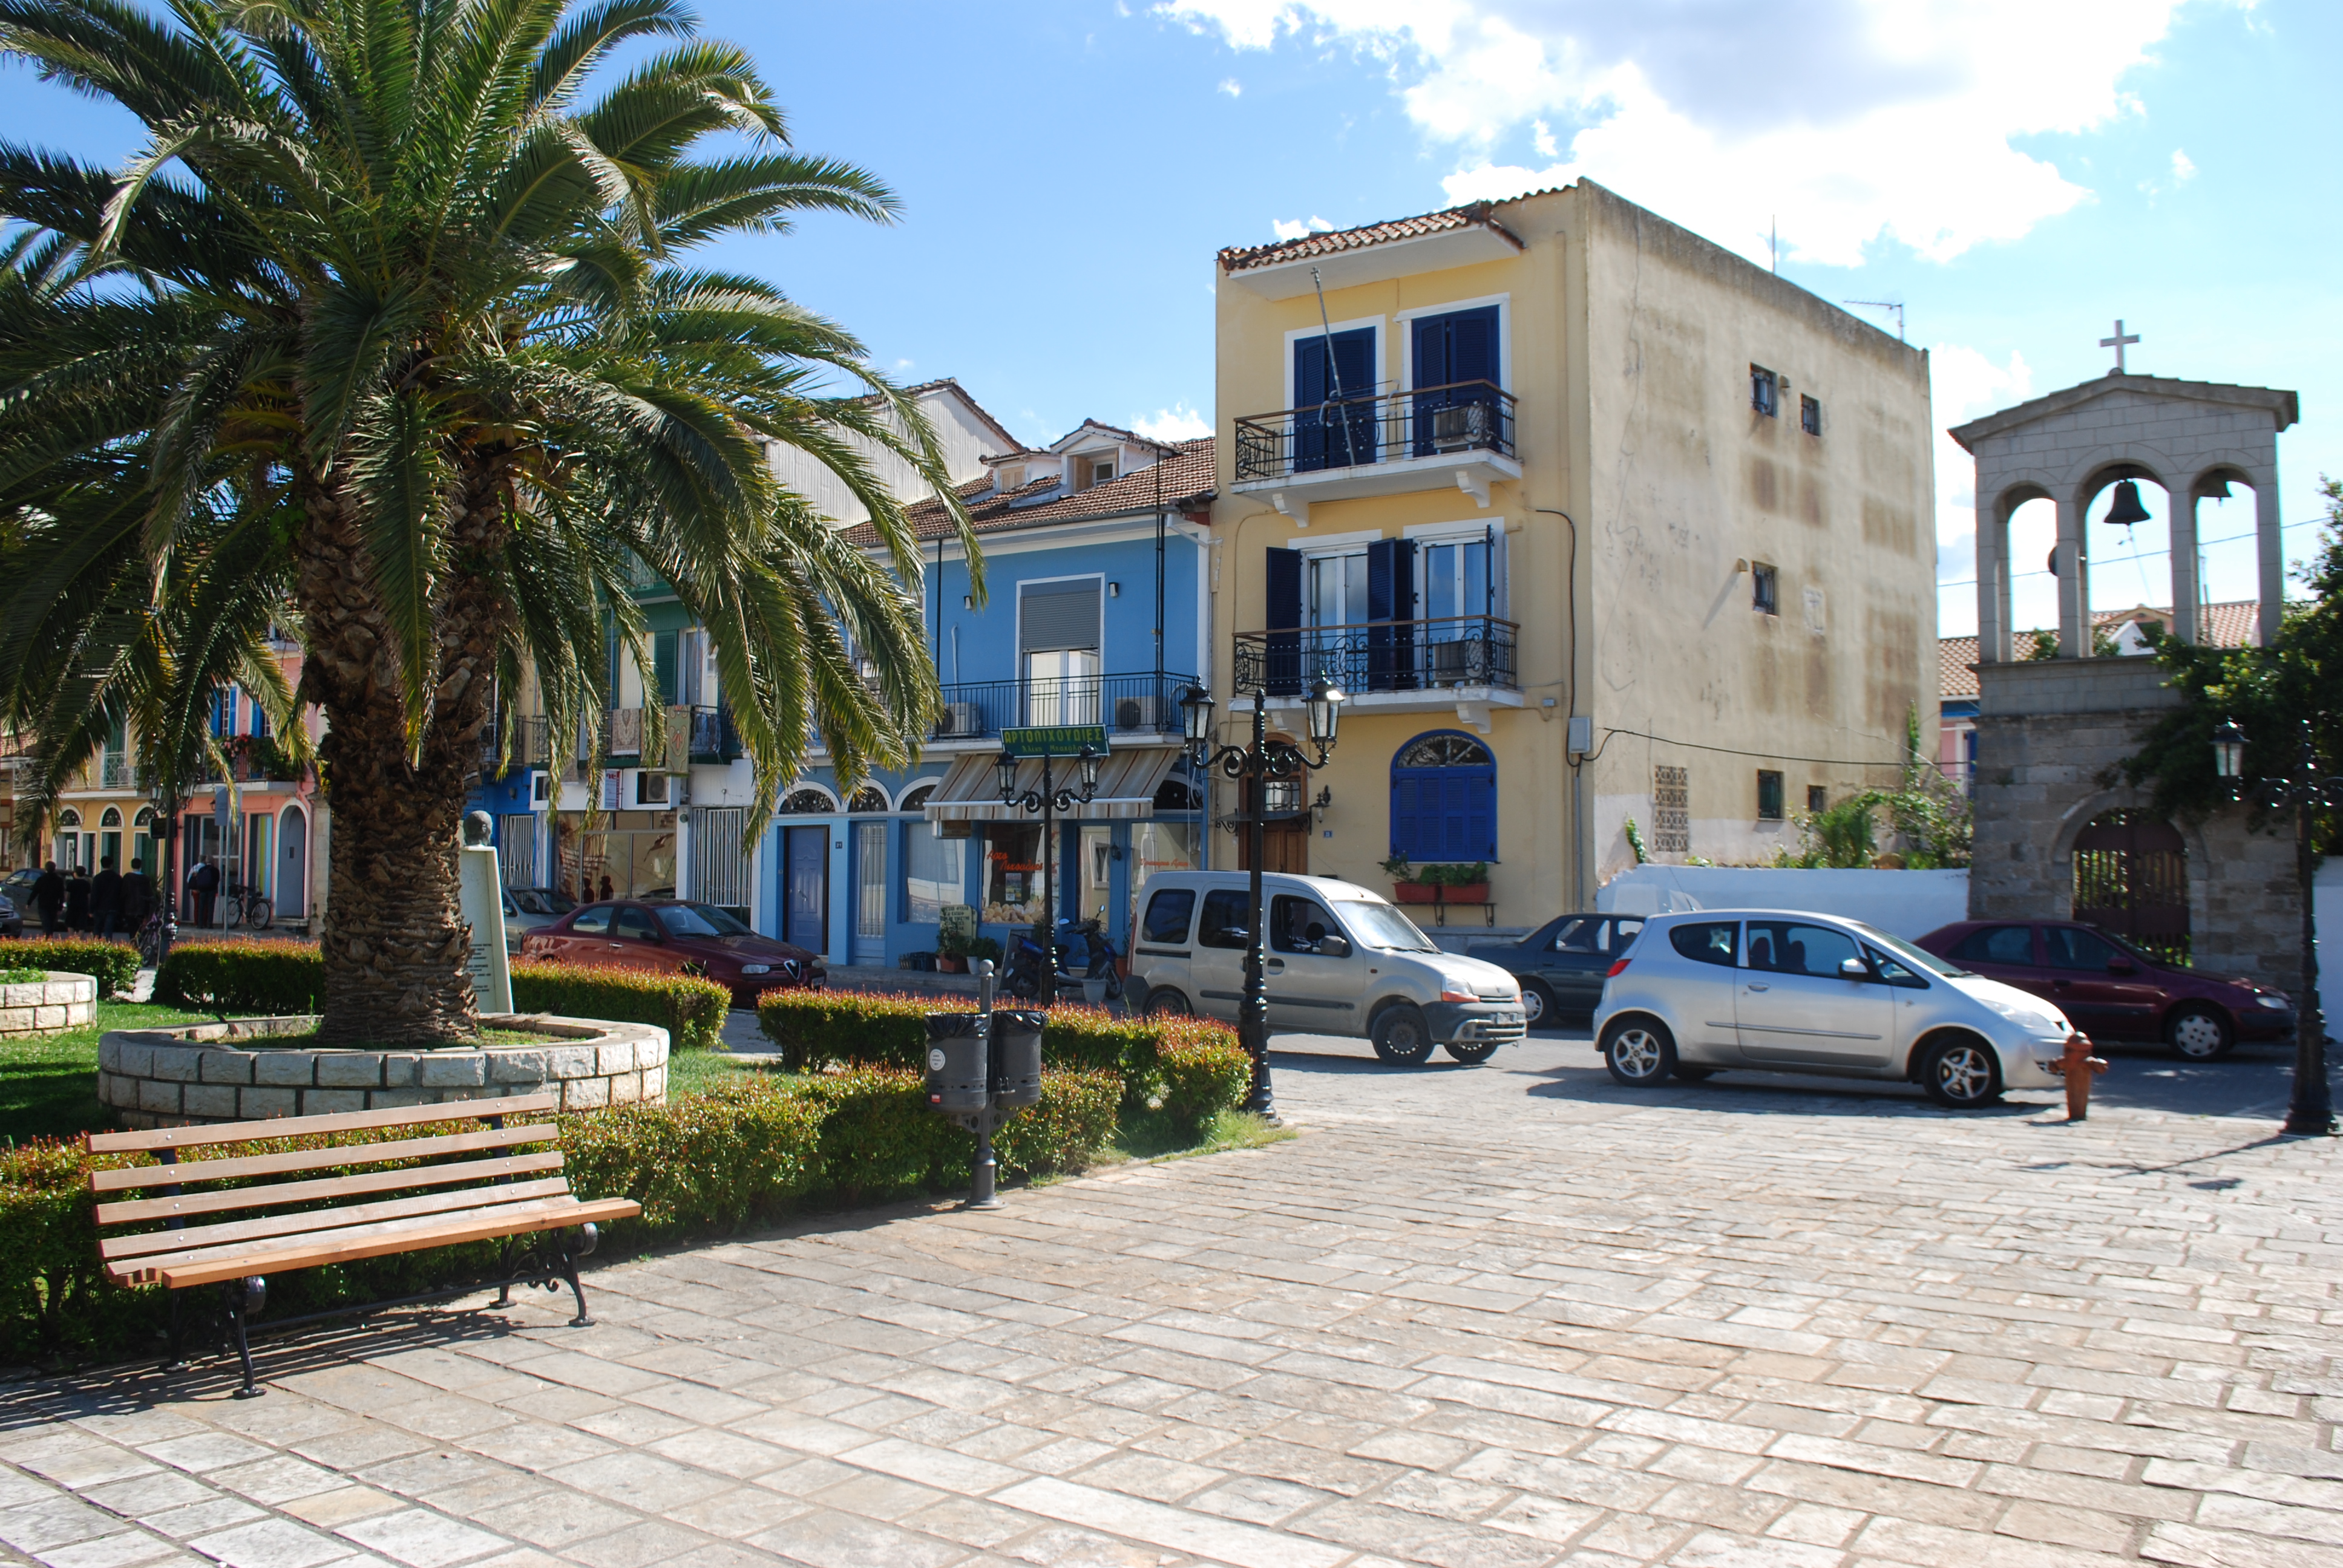
Vonitsa
Vonitsa (Greek: Βόνιτσα) is a town in the northwestern part of Aetolia-Acarnania in Greece, seat of the municipality of Aktio-Vonitsa. Population 4,081 (2001). The beach town is situated on the south coast of the Ambracian Gulf, and is dominated by a..
Vonitsa Wikipedia Page

About Our Data
The data on this page is estimated using a number of publicly available tools and resources. It is provided without warranty, and could contain inaccuracies. Use at your own risk.