Categories in Lovran
Industries
Business Distribution by Industry in Lovran
| Industry Description | Number of Establishments |
|---|---|
| Other accommodation | 124 |
| Real estate | 64 |
| Restaurants | 38 |
| Holiday homes, cabins and resorts | 26 |
| Hotels and motels | 24 |
| Bars, pubs and taverns | 17 |
| Grocery stores and supermarkets | 12 |
| Cafes | 11 |
| Shopping | 10 |
| Atm's | 10 |
| Beauty salons | 10 |
Lovran Facts
| Area | 3.7 km² |
| Population | 6,575 |
| Male Population | 3,082 (46.9%) |
| Female Population | 3,493 (53.1%) |
| Population change (1975 to 2020) | +6.0% |
| Population change (2000 to 2020) | -1.8% |
| Median Age | 48.2 years (Male: 45.5, Female: 50.5) |
| Local Time | |
| Timezone | Central European Summer Time |
| Lat & Lng | 45.29194, 14.27417 |
| Postal Codes | 51414 |
Map of Lovran
Interactive Map
Lovran Population
Years 1975 to 2020
| Data | 1975 | 1990 | 2000 | 2015 | 2020 |
|---|---|---|---|---|---|
| Population | 6,201 | 6,916 | 6,694 | 6,446 | 6,575 |
| Population Density | 1,681.6 / km² | 1,875.5 / km² | 1,815.3 / km² | 1,748.1 / km² | 1,783.1 / km² |
Lovran Population change from 2000 to 2015
Decrease of 3.7% from year 2000 to 2015
| Location | Change since 1975 | Change since 1990 | Change since 2000 |
|---|---|---|---|
| Lovran | +4% | -6.8% | -3.7% |
| Istria County | +8.7% | -3.4% | +0.5% |
| Croatia | -6.1% | -11.4% | -4.3% |
Lovran Median Age
Median Age: 48.2 years
| Location | Median Age | Median Age (Female) | Median Age (Male) |
|---|---|---|---|
| Lovran | 48.2 yrs | 50.5 yrs | 45.5 yrs |
| Istria County | 44 yrs | 45.8 yrs | 42 yrs |
| Croatia | 42 yrs | 44.1 yrs | 40 yrs |
Lovran Population Density
Population Density: 1,783 / km²
| Location | Population | Area | Density |
|---|---|---|---|
| Lovran | 6,575 | 3.688 km² | 1,783 / km² |
| Istria County | 204,278 | 2,808.7 km² | 72.7 / km² |
| Croatia | 4.2 million | 56,366.2 km² | 73.9 / km² |
Lovran Historical and Projected Population
Estimated Population from 1600 to 2100
- JRC (European Commission's Joint Research Centre) work on the GHS built-up grid
- CIESIN (Center for International Earth Science Information Network)
- [Link] Klein Goldewijk, K., Beusen, A., Doelman, J., and Stehfest, E.: Anthropogenic land use estimates for the Holocene – HYDE 3.2, Earth Syst. Sci. Data, 9, 927–953, https://doi.org/10.5194/essd-9-927-2017, 2017.
Area Codes
Percentage Area Codes used by businesses in Lovran
Price Distribution
Business distribution by price for Lovran
Human Development Index (HDI)
Statistic composite index of life expectancy, education, and per capita income.
Lovran CO2 Emissions
Carbon Dioxide (CO2) Emissions Per Capita in Tonnes Per Year
| Location | CO2 Emissions | CO2 Emissions Per Capita | CO2 Emissions Intensity |
|---|---|---|---|
| Lovran | 41,802 tn | 6.36 tn | 11,336.1 tons/km² |
| Istria County | 1,295,363 tn | 6.34 tn | 461.2 tons/km² |
| Croatia | 23,288,703 tn | 5.59 tn | 413.2 tons/km² |
| 2013 CO2 emissions (tonnes/year) | 41,802 tn |
| 2013 CO2 emissions (tonnes/year) per capita | 6.36 tn |
| 2013 CO2 emissions intensity (tonnes/km²/year) | 11,336.1 tons/km² |
Natural Hazards Risk
Relative risk out of 10
| Hazard | Risk Level |
|---|---|
| Earthquake | Medium (6) |
| Landslide | Medium (6) |
* Risk, particularly concerning flood or landslide, may not be for the entire area.
- Dilley, M., R.S. Chen, U. Deichmann, A.L. Lerner-Lam, M. Arnold, J. Agwe, P. Buys, O. Kjekstad, B. Lyon, and G. Yetman. 2005. Natural Disaster Hotspots: A Global Risk Analysis. Washington, D.C.: World Bank. https://doi.org/10.1596/0-8213-5930-4.
- Center for Hazards and Risk Research - CHRR - Columbia University, Center for International Earth Science Information Network - CIESIN - Columbia University, and Norwegian Geotechnical Institute - NGI. 2005. Global Landslide Hazard Distribution. Palisades, NY: NASA Socioeconomic Data and Applications Center (SEDAC). https://doi.org/10.7927/H4P848VZ.
- Center for Hazards and Risk Research - CHRR - Columbia University, Center for International Earth Science Information Network - CIESIN - Columbia University. 2005. Global Earthquake Hazard Distribution - Peak Ground Acceleration. Palisades, NY: NASA Socioeconomic Data and Applications Center (SEDAC). https://doi.org/10.7927/H4BZ63ZS.
Recent Nearby Earthquakes
Magnitude 3.0 and greater
| Date▼ | Time↕ | Magnitude↕ | Distance↕ | Depth↕ | Location↕ | Link |
|---|---|---|---|---|---|---|
| 8/8/17 | 9:35 AM | 4 | 27.8 km | 10,000 m | 3km E of Omisalj, Croatia | usgs.gov |
| 4/22/14 | 8:58 AM | 4.5 | 38 km | 4,600 m | 6km SE of Pivka, Slovenia | usgs.gov |
| 10/21/08 | 8:12 AM | 3.4 | 45.1 km | 10,000 m | Slovenia | usgs.gov |
| 10/6/08 | 9:19 AM | 3.3 | 14.6 km | 10,000 m | Slovenia-Croatia border region | usgs.gov |
| 12/15/07 | 10:12 PM | 3 | 45 km | 10,000 m | Slovenia-Croatia border region | usgs.gov |
| 6/10/07 | 8:48 PM | 3.2 | 22.6 km | 10,000 m | Croatia | usgs.gov |
| 8/7/06 | 4:59 AM | 3 | 38.6 km | 10,000 m | Croatia | usgs.gov |
| 4/24/05 | 6:34 PM | 4.4 | 31 km | 10,000 m | Slovenia | usgs.gov |
| 3/9/05 | 2:46 PM | 3.4 | 22.4 km | 5,000 m | Croatia | usgs.gov |
| 9/14/04 | 6:09 PM | 4.2 | 24 km | 10,000 m | Croatia | usgs.gov |
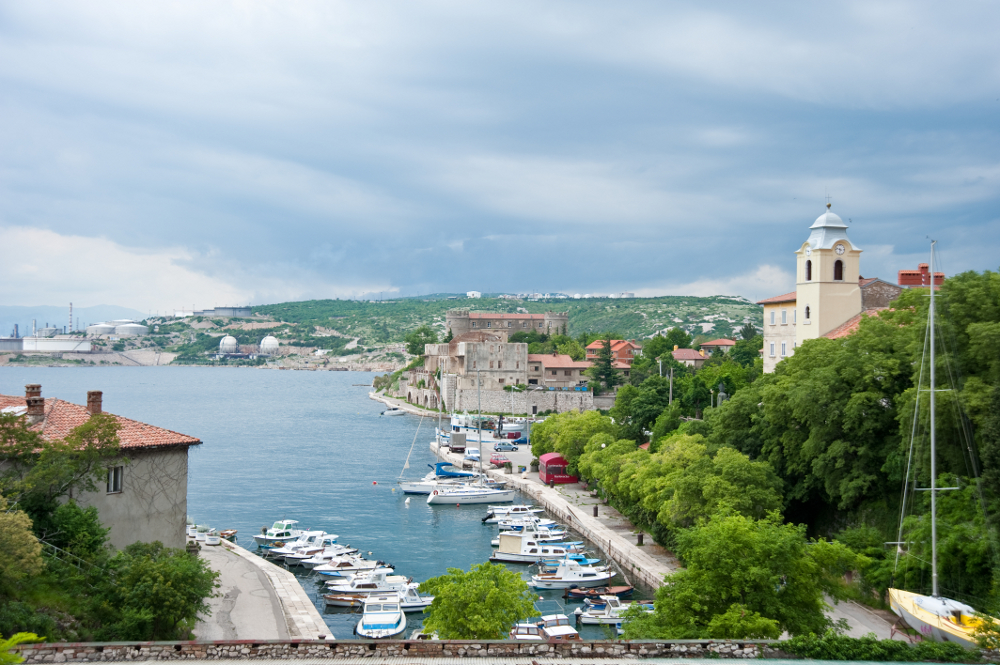
Lovran
Lovran (Italian: Laurana, German: Lauran) is a town in Istria, Croatia. It is situated on the western coast of the Kvarner Bay with a population of 4,101 (2011 census). Its name derives from Laurel (Laurus nobilis), as shown in the coat of arms. is ..
Lovran Wikipedia Page


About Our Data
The data on this page is estimated using a number of publicly available tools and resources. It is provided without warranty, and could contain inaccuracies. Use at your own risk.