Categories in Blitar
Industries
Business Distribution by Industry in Blitar
| Industry Description | Number of Establishments | Average Age of Business |
|---|---|---|
| Shopping | 13,181 | 14 years |
| Restaurants | 7,136 | — |
| Cafes | 5,604 | — |
| Education | 4,177 | 37 years |
| Religion | 4,061 | — |
| Grocery stores and supermarkets | 3,098 | — |
| Mosques | 2,910 | — |
| Clothing stores | 2,791 | — |
| Corporate management | 1,962 | — |
| American restaurants | 1,906 | — |
| Beauty salons | 1,776 | — |
| Electronics stores | 1,721 | 14 years |
| Car repair | 1,621 | — |
Blitar Facts
| Area | 551.4 km² |
| Population | 844,124 |
| Male Population | 421,708 (50.0%) |
| Female Population | 422,416 (50.0%) |
| Population change (1975 to 2020) | +30.9% |
| Population change (2000 to 2020) | +5.3% |
| Median Age | 32.4 years (Male: 31.7, Female: 33.1) |
| Area Codes | 34, 342 |
| Neighborhoods | Kepanjen Kidul, Kepanjenkidul, Pakunden, Sukorejo, Beru, Wlingi, Kesamben, Kademangan |
| Local Time | |
| Timezone | Western Indonesia Time |
| Lat & Lng | -8.09830, 112.16810 |
| Postal Codes | 66111, 66112, 66113, 66114, 66115, More |
Map of Blitar
Interactive Map
Blitar Population
Years 1975 to 2020
| Data | 1975 | 1990 | 2000 | 2015 | 2020 |
|---|---|---|---|---|---|
| Population | 644,731 | 808,977 | 801,595 | 806,882 | 844,124 |
| Population Density | 1,169.3 / km² | 1,467.2 / km² | 1,453.8 / km² | 1,463.4 / km² | 1,530.9 / km² |
Blitar Population change from 2000 to 2015
Increase of 0.7% from year 2000 to 2015
| Location | Change since 1975 | Change since 1990 | Change since 2000 |
|---|---|---|---|
| Blitar | +25.2% | -0.3% | +0.7% |
| East Java | +400.7% | +208.6% | +34.2% |
| Indonesia | +96.9% | +41.9% | +21.7% |
Blitar Median Age
Median Age: 32.4 years
| Location | Median Age | Median Age (Female) | Median Age (Male) |
|---|---|---|---|
| Blitar | 32.4 yrs | 33.1 yrs | 31.7 yrs |
| East Java | 31.9 yrs | 32.6 yrs | 31.2 yrs |
| Indonesia | 27.2 yrs | 27.5 yrs | 26.9 yrs |
Blitar Population Density
Population Density: 1,531 / km²
| Location | Population | Area | Density |
|---|---|---|---|
| Blitar | 844,124 | 551.4 km² | 1,531 / km² |
| East Java | 8,036 | 32.3 km² | 249 / km² |
| Indonesia | 252.8 million | 1,893,657.8 km² | 134 / km² |
Blitar Historical and Projected Population
Estimated Population from 600 to 2100
- JRC (European Commission's Joint Research Centre) work on the GHS built-up grid
- CIESIN (Center for International Earth Science Information Network)
- [Link] Klein Goldewijk, K., Beusen, A., Doelman, J., and Stehfest, E.: Anthropogenic land use estimates for the Holocene – HYDE 3.2, Earth Syst. Sci. Data, 9, 927–953, https://doi.org/10.5194/essd-9-927-2017, 2017.
Neighborhoods in Blitar
Percentage of businesses by neighborhood in Blitar
Area Codes
Percentage Area Codes used by businesses in Blitar
Postal Codes
Percentage of businesses by Postal Codes in Blitar
Price Distribution
Business distribution by price for Blitar
Human Development Index (HDI)
Statistic composite index of life expectancy, education, and per capita income.
Blitar CO2 Emissions
Carbon Dioxide (CO2) Emissions Per Capita in Tonnes Per Year
| Location | CO2 Emissions | CO2 Emissions Per Capita | CO2 Emissions Intensity |
|---|---|---|---|
| Blitar | 1,767,536 tn | 2.09 tn | 3,205.7 tons/km² |
| East Java | 10,993 tn | 1.37 tn | 340.4 tons/km² |
| Indonesia | 478,610,416 tn | 1.89 tn | 252.7 tons/km² |
| 2013 CO2 emissions (tonnes/year) | 1,767,536 tn |
| 2013 CO2 emissions (tonnes/year) per capita | 2.09 tn |
| 2013 CO2 emissions intensity (tonnes/km²/year) | 3,205.7 tons/km² |
Natural Hazards Risk
Relative risk out of 10
| Hazard | Risk Level |
|---|---|
| Drought | Medium (5) |
| Flood | High (10) |
| Earthquake | Medium (6) |
| Landslide | Medium (7) |
| Volcano | High (9) |
* Risk, particularly concerning flood or landslide, may not be for the entire area.
- Dilley, M., R.S. Chen, U. Deichmann, A.L. Lerner-Lam, M. Arnold, J. Agwe, P. Buys, O. Kjekstad, B. Lyon, and G. Yetman. 2005. Natural Disaster Hotspots: A Global Risk Analysis. Washington, D.C.: World Bank. https://doi.org/10.1596/0-8213-5930-4.
- Center for Hazards and Risk Research - CHRR - Columbia University, Center for International Earth Science Information Network - CIESIN - Columbia University, and Norwegian Geotechnical Institute - NGI. 2005. Global Landslide Hazard Distribution. Palisades, NY: NASA Socioeconomic Data and Applications Center (SEDAC). https://doi.org/10.7927/H4P848VZ.
- Center for Hazards and Risk Research - CHRR - Columbia University, Center for International Earth Science Information Network - CIESIN - Columbia University, and International Research Institute for Climate and Society - IRI - Columbia University. 2005. Global Drought Hazard Frequency and Distribution. Palisades, NY: NASA Socioeconomic Data and Applications Center (SEDAC). https://doi.org/10.7927/H4VX0DFT.
- Center for Hazards and Risk Research - CHRR - Columbia University, Center for International Earth Science Information Network - CIESIN - Columbia University. 2005. Global Flood Hazard Frequency and Distribution. Palisades, NY: NASA Socioeconomic Data and Applications Center (SEDAC). https://doi.org/10.7927/H4668B3D.
- Center for Hazards and Risk Research - CHRR - Columbia University, Center for International Earth Science Information Network - CIESIN - Columbia University. 2005. Global Volcano Hazard Frequency and Distribution. Palisades, NY: NASA Socioeconomic Data and Applications Center (SEDAC). https://doi.org/10.7927/H4BR8Q45.
- Center for Hazards and Risk Research - CHRR - Columbia University, Center for International Earth Science Information Network - CIESIN - Columbia University. 2005. Global Earthquake Hazard Distribution - Peak Ground Acceleration. Palisades, NY: NASA Socioeconomic Data and Applications Center (SEDAC). https://doi.org/10.7927/H4BZ63ZS.
Recent Nearby Earthquakes
Magnitude 3.0 and greater
| Date▼ | Time↕ | Magnitude↕ | Distance↕ | Depth↕ | Location↕ | Link |
|---|---|---|---|---|---|---|
| 6/27/18 | 3:48 AM | 4.1 | 60.4 km | 86,370 m | 34km S of Sumbersih, Indonesia | usgs.gov |
| 6/4/18 | 5:42 AM | 4.3 | 52.9 km | 108,120 m | 22km SSW of Jengglungharjo, Indonesia | usgs.gov |
| 3/15/18 | 8:25 PM | 4.4 | 62.5 km | 131,700 m | 14km E of Krajan Ngrambingan, Indonesia | usgs.gov |
| 4/8/17 | 8:17 AM | 3.9 | 50 km | 61,710 m | 0km ESE of Bureng, Indonesia | usgs.gov |
| 12/10/16 | 5:28 AM | 4.2 | 54.3 km | 43,300 m | 21km SW of Krajan, Indonesia | usgs.gov |
| 10/16/16 | 5:45 PM | 4.4 | 68.1 km | 166,430 m | 9km NE of Jombang, Indonesia | usgs.gov |
| 9/23/16 | 11:33 PM | 4.2 | 37.7 km | 150,370 m | 5km WSW of Tiang, Indonesia | usgs.gov |
| 8/2/16 | 11:15 AM | 4.1 | 52.1 km | 123,090 m | 9km SSW of Trenggalek, Indonesia | usgs.gov |
| 3/2/16 | 6:09 AM | 5.1 | 70.4 km | 78,320 m | 30km SSW of Krajan Sidodadi, Indonesia | usgs.gov |
| 9/10/15 | 4:19 PM | 4.8 | 67.8 km | 66,210 m | 31km SSW of Gombangan, Indonesia | usgs.gov |
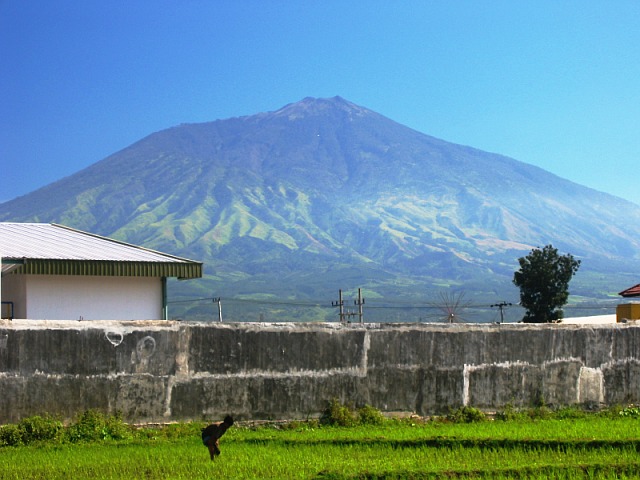
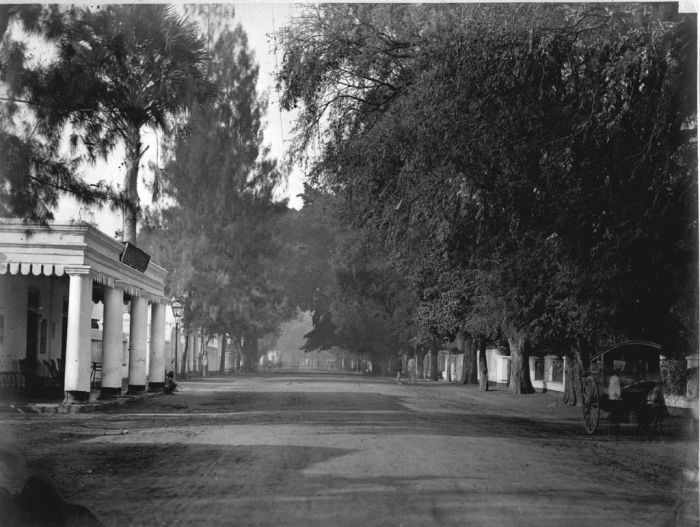
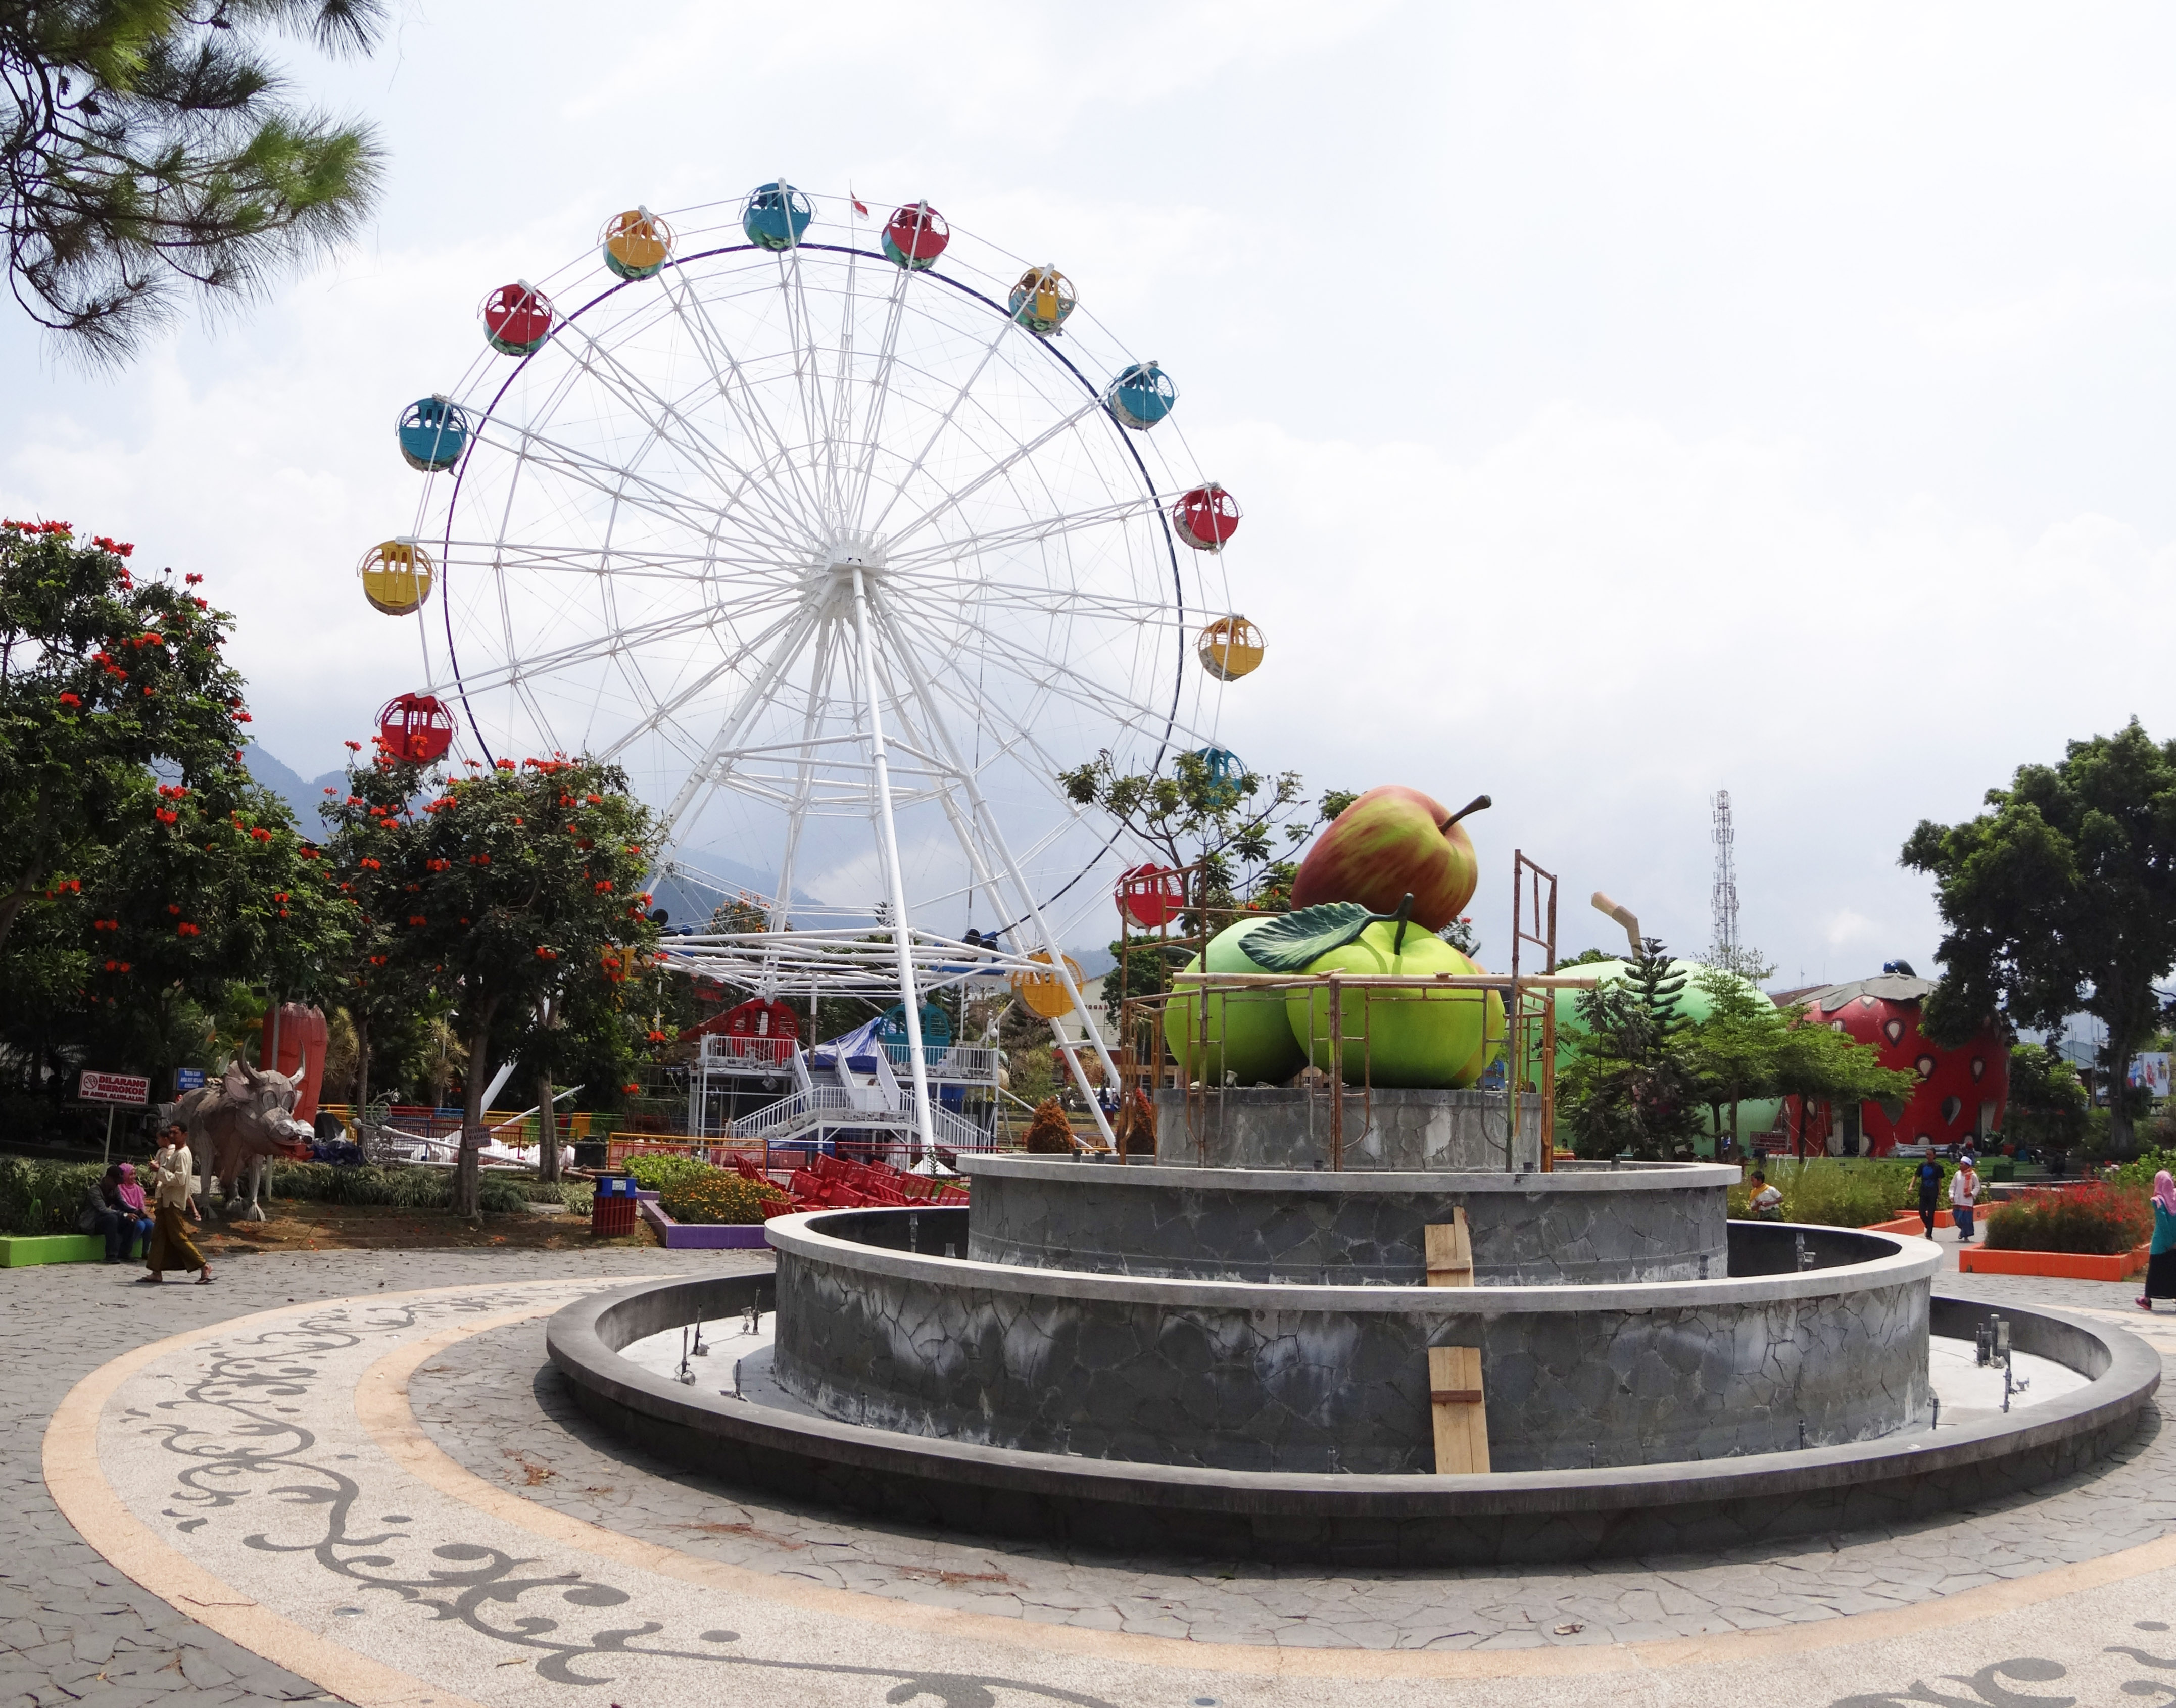
Blitar
Blitar is a city in East Java, Indonesia, about 73 km from Malang and 167 km from Surabaya. The area lies within longitude 111° 40' - 112° 09' East and its latitude is 8° 06' South. Blitar has several temples from Majapahit Empire era, such as Penata..
Blitar Wikipedia Page
About Our Data
The data on this page is estimated using a number of publicly available tools and resources. It is provided without warranty, and could contain inaccuracies. Use at your own risk.