Categories in Glodok
Industries
Business Distribution by Industry in Glodok
| Industry Description | Number of Establishments |
|---|---|
| Shopping | 379 |
| Electronics stores | 194 |
| Hardware store | 144 |
| Wholesale of machinery | 63 |
| Household appliances and goods | 40 |
| Banks | 39 |
| Corporate management | 31 |
| Wholesale of construction supplies | 30 |
| Clothing stores | 27 |
| Restaurants | 25 |
| Atm's | 19 |
Glodok Facts
| Area | 1.1 km² |
| Population | 28,360 |
| Male Population | 14,472 (51.0%) |
| Female Population | 13,888 (49.0%) |
| Population change (1975 to 2020) | +138.7% |
| Population change (2000 to 2020) | +30.7% |
| Median Age | 27.5 years (Male: 27.7, Female: 27.2) |
| Neighborhoods | Glodok, Jakarta Barat, Kota Tua, Glodok, Tamansari, Tambora, Grogol Petamburan |
| Local Time | |
| Timezone | Western Indonesia Time |
| Lat & Lng | -6.14750, 106.81340 |
| Postal Codes | 11120, 11180, 11220 |
Map of Glodok
Interactive Map
Glodok Population
Years 1975 to 2020
| Data | 1975 | 1990 | 2000 | 2015 | 2020 |
|---|---|---|---|---|---|
| Population | 11,883 | 18,127 | 21,696 | 27,068 | 28,360 |
| Population Density | 10,562.7 / km² | 16,112.9 / km² | 19,285.3 / km² | 24,060.4 / km² | 25,208.9 / km² |
Glodok Population change from 2000 to 2015
Increase of 24.8% from year 2000 to 2015
| Location | Change since 1975 | Change since 1990 | Change since 2000 |
|---|---|---|---|
| Glodok | +127.8% | +49.3% | +24.8% |
| Jakarta | +126.8% | +48.7% | +24.7% |
| Indonesia | +96.9% | +41.9% | +21.7% |
Glodok Median Age
Median Age: 27.5 years
| Location | Median Age | Median Age (Female) | Median Age (Male) |
|---|---|---|---|
| Glodok | 27.5 yrs | 27.2 yrs | 27.7 yrs |
| Jakarta | 27.5 yrs | 27.2 yrs | 27.8 yrs |
| Indonesia | 27.2 yrs | 27.5 yrs | 26.9 yrs |
Glodok Population Density
Population Density: 25,209 / km²
| Location | Population | Area | Density |
|---|---|---|---|
| Glodok | 28,360 | 1.125 km² | 25,209 / km² |
| Jakarta | 3,010 | 0.139 km² | 21,696 / km² |
| Indonesia | 252.8 million | 1,893,657.8 km² | 134 / km² |
Glodok Historical and Projected Population
Estimated Population from 1850 to 2100
- JRC (European Commission's Joint Research Centre) work on the GHS built-up grid
- CIESIN (Center for International Earth Science Information Network)
- [Link] Klein Goldewijk, K., Beusen, A., Doelman, J., and Stehfest, E.: Anthropogenic land use estimates for the Holocene – HYDE 3.2, Earth Syst. Sci. Data, 9, 927–953, https://doi.org/10.5194/essd-9-927-2017, 2017.
Neighborhoods in Glodok
Percentage of businesses by neighborhood in Glodok
Price Distribution
Business distribution by price for Glodok
Human Development Index (HDI)
Statistic composite index of life expectancy, education, and per capita income.
Glodok CO2 Emissions
Carbon Dioxide (CO2) Emissions Per Capita in Tonnes Per Year
| Location | CO2 Emissions | CO2 Emissions Per Capita | CO2 Emissions Intensity |
|---|---|---|---|
| Glodok | 56,345 tn | 1.99 tn | 50,084.1 tons/km² |
| Jakarta | 8,549 tn | 2.84 tn | 61,621.9 tons/km² |
| Indonesia | 478,610,416 tn | 1.89 tn | 252.7 tons/km² |
| 2013 CO2 emissions (tonnes/year) | 56,345 tn |
| 2013 CO2 emissions (tonnes/year) per capita | 1.99 tn |
| 2013 CO2 emissions intensity (tonnes/km²/year) | 50,084.1 tons/km² |
Natural Hazards Risk
Relative risk out of 10
| Hazard | Risk Level |
|---|---|
| Drought | Medium (5) |
| Flood | High (10) |
| Earthquake | Medium (7) |
* Risk, particularly concerning flood or landslide, may not be for the entire area.
- Dilley, M., R.S. Chen, U. Deichmann, A.L. Lerner-Lam, M. Arnold, J. Agwe, P. Buys, O. Kjekstad, B. Lyon, and G. Yetman. 2005. Natural Disaster Hotspots: A Global Risk Analysis. Washington, D.C.: World Bank. https://doi.org/10.1596/0-8213-5930-4.
- Center for Hazards and Risk Research - CHRR - Columbia University, Center for International Earth Science Information Network - CIESIN - Columbia University, and International Research Institute for Climate and Society - IRI - Columbia University. 2005. Global Drought Hazard Frequency and Distribution. Palisades, NY: NASA Socioeconomic Data and Applications Center (SEDAC). https://doi.org/10.7927/H4VX0DFT.
- Center for Hazards and Risk Research - CHRR - Columbia University, Center for International Earth Science Information Network - CIESIN - Columbia University. 2005. Global Flood Hazard Frequency and Distribution. Palisades, NY: NASA Socioeconomic Data and Applications Center (SEDAC). https://doi.org/10.7927/H4668B3D.
- Center for Hazards and Risk Research - CHRR - Columbia University, Center for International Earth Science Information Network - CIESIN - Columbia University. 2005. Global Earthquake Hazard Distribution - Peak Ground Acceleration. Palisades, NY: NASA Socioeconomic Data and Applications Center (SEDAC). https://doi.org/10.7927/H4BZ63ZS.
Recent Nearby Earthquakes
Magnitude 3.0 and greater
| Date▼ | Time↕ | Magnitude↕ | Distance↕ | Depth↕ | Location↕ | Link |
|---|---|---|---|---|---|---|
| 10/24/18 | 9:45 PM | 4 | 54.5 km | 291,550 m | 35km NNW of Rengasdengklok, Indonesia | usgs.gov |
| 9/24/18 | 5:53 PM | 4.2 | 27.4 km | 254,370 m | 15km NNE of Bekasi, Indonesia | usgs.gov |
| 4/2/18 | 1:02 PM | 4.3 | 50.3 km | 250,040 m | 5km NW of Rengasdengklok, Indonesia | usgs.gov |
| 3/27/18 | 8:57 PM | 4.5 | 24.2 km | 139,150 m | 0km NE of Serpong, Indonesia | usgs.gov |
| 9/25/17 | 6:10 PM | 5.1 | 52.9 km | 150,050 m | 10km ENE of Langgen, Indonesia | usgs.gov |
| 8/13/17 | 12:04 PM | 4.2 | 35.6 km | 170,960 m | 7km S of Curug, Indonesia | usgs.gov |
| 5/10/17 | 5:46 PM | 4.6 | 56.1 km | 121,110 m | 5km E of Sidoger Lebak, Indonesia | usgs.gov |
| 4/5/17 | 8:20 AM | 4 | 53.9 km | 169,660 m | 58km NE of Teluknaga, Indonesia | usgs.gov |
| 3/26/17 | 3:06 PM | 4 | 10.6 km | 195,000 m | 14km NNE of Jakarta, Indonesia | usgs.gov |
| 12/13/16 | 11:28 AM | 4.5 | 78 km | 123,640 m | 9km SSE of Cicurug, Indonesia | usgs.gov |
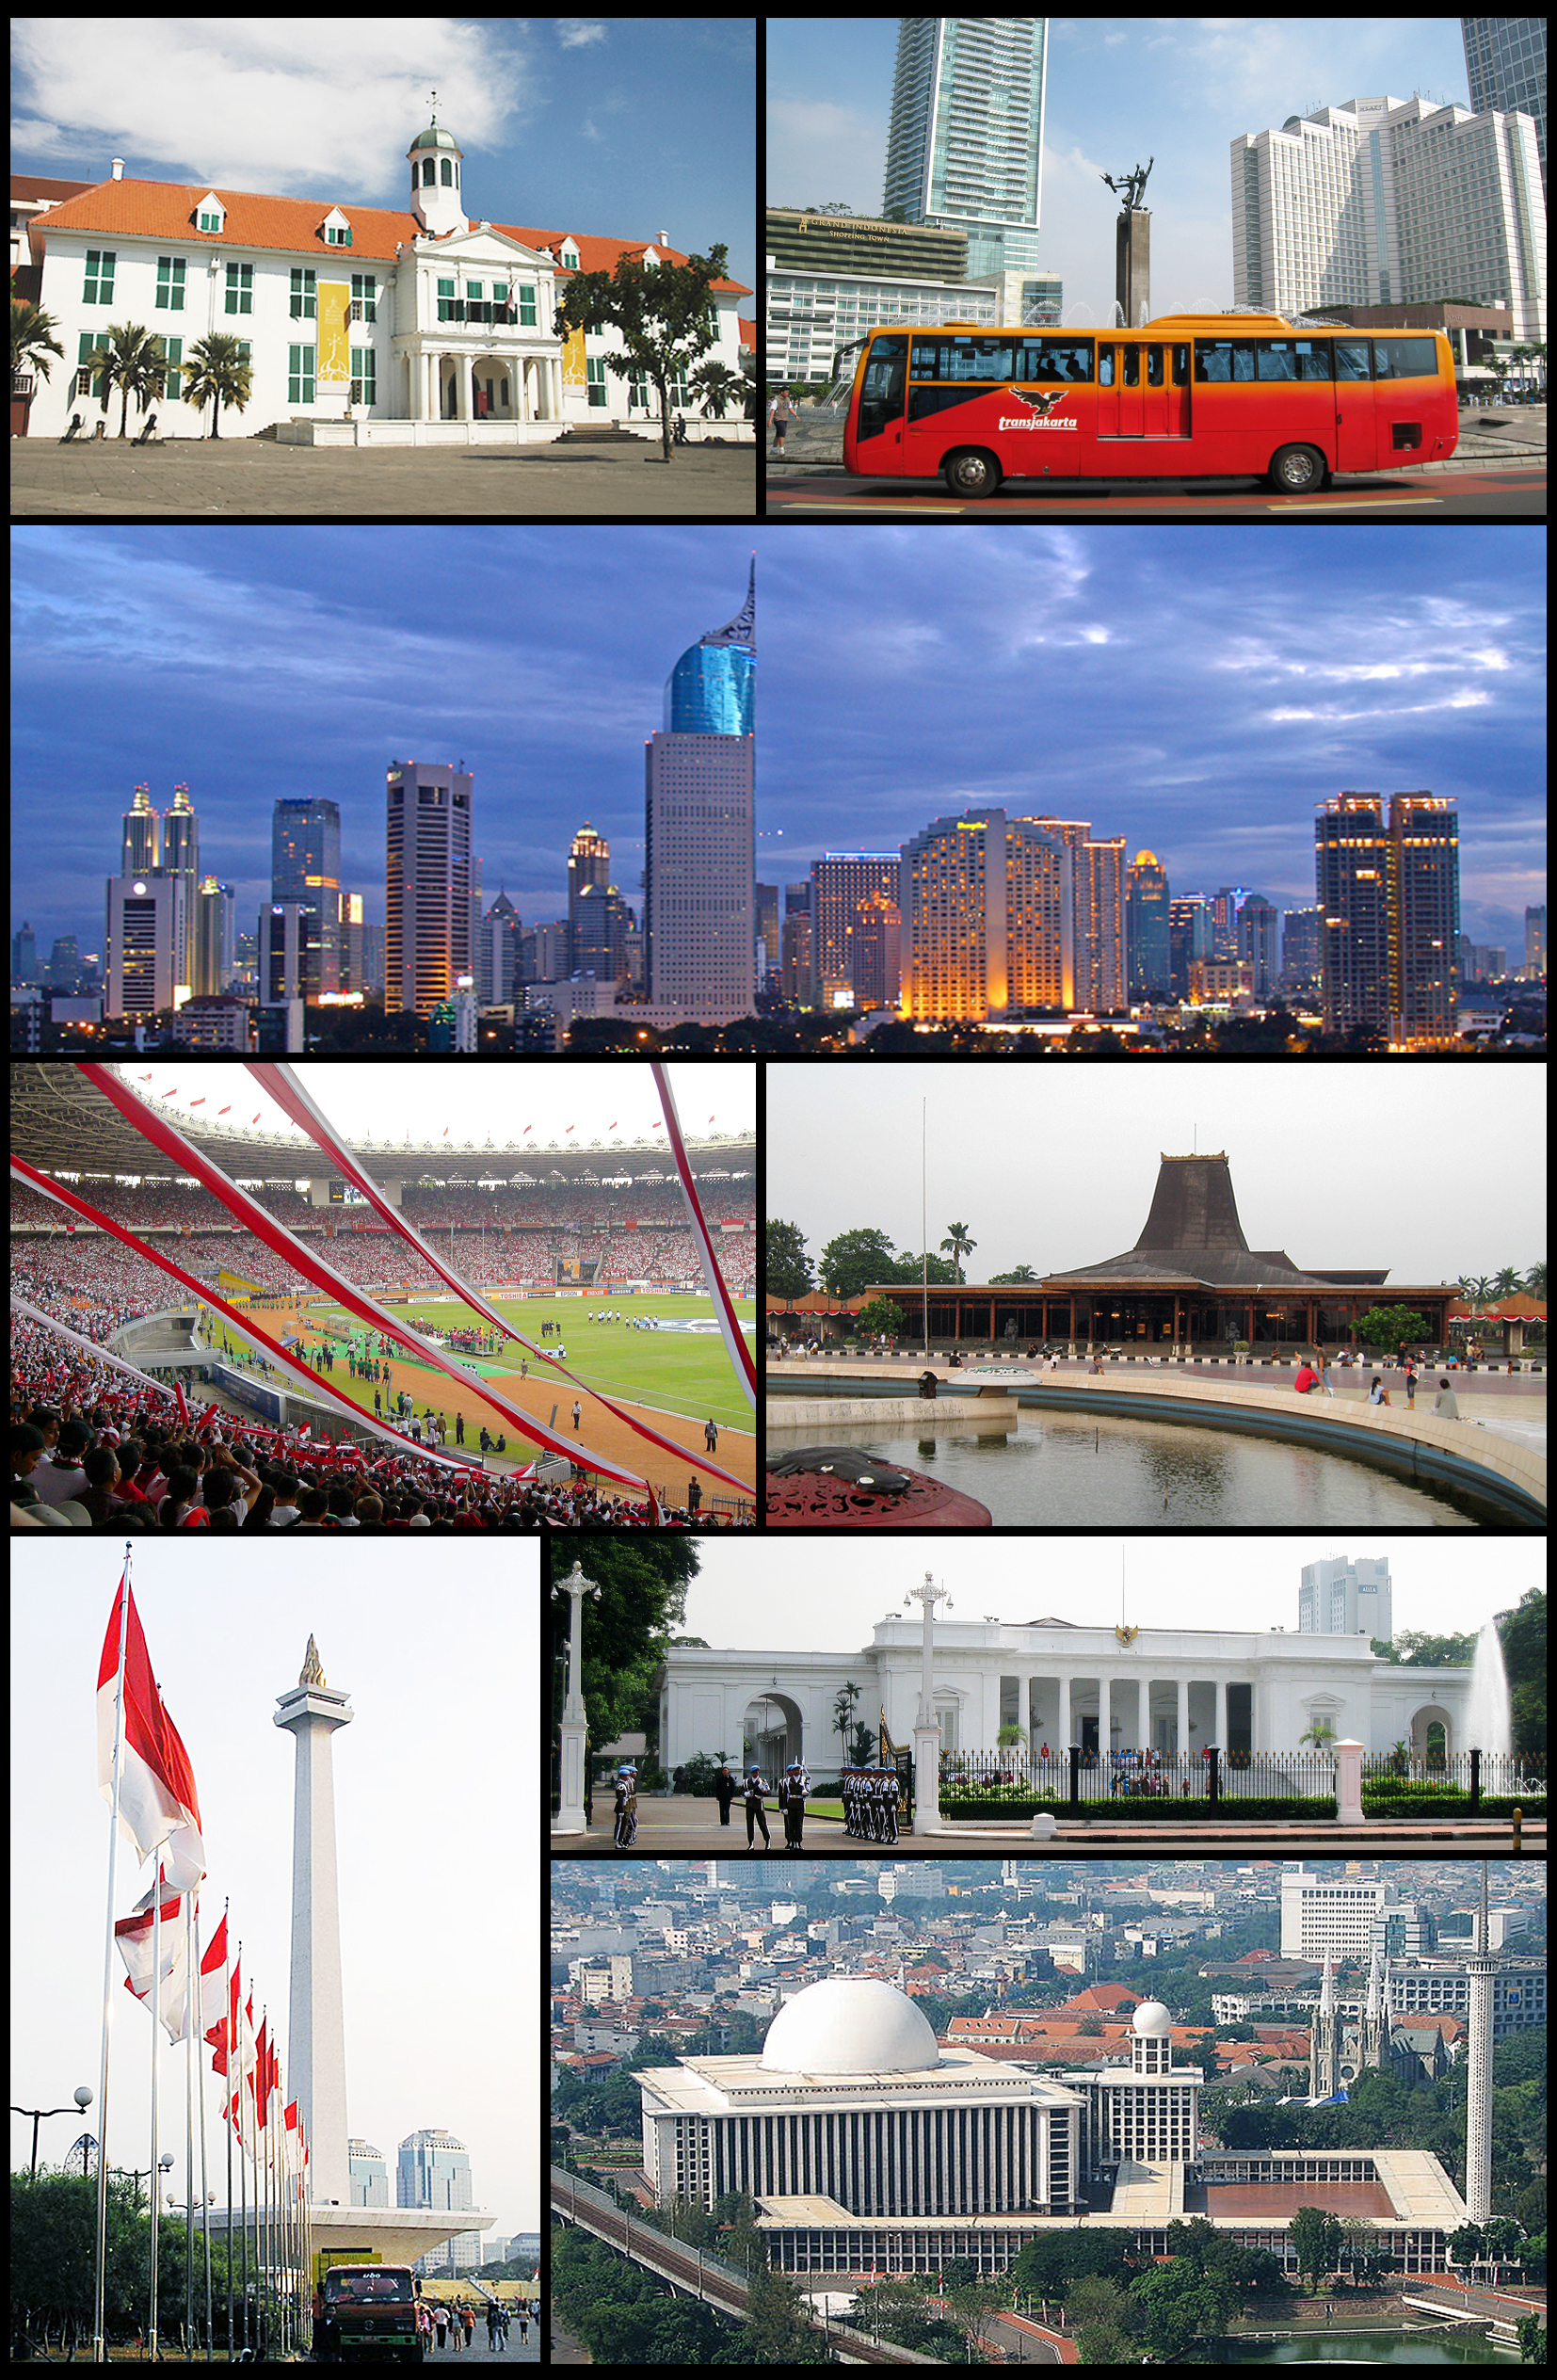
Glodok
Glodok (Chinese: 裹踱刻) is a part of Jakarta, Indonesia. The area is also known as Pecinan or Chinatown since the Dutch colonial era, and is considered the biggest in Indonesia, as a majority of the traders in Glodok are of Chinese descent. the area i..
Glodok Wikipedia Page


About Our Data
The data on this page is estimated using a number of publicly available tools and resources. It is provided without warranty, and could contain inaccuracies. Use at your own risk.