Categories in Puncak
Industries
Business Distribution by Industry in Puncak
| Industry Description | Number of Establishments |
|---|---|
| Other accommodation | 681 |
| Holiday homes, cabins and resorts | 523 |
| Restaurants | 465 |
| Hotels and motels | 284 |
| Shopping | 265 |
| Cafes | 208 |
| Religion | 152 |
| Education | 129 |
| Mosques | 110 |
| Grocery stores and supermarkets | 108 |
| Travel agencies | 83 |
| Travel and transportation | 72 |
Puncak Facts
| Area | 74.0 km² |
| Population | 257,213 |
| Male Population | 132,288 (51.4%) |
| Female Population | 124,925 (48.6%) |
| Population change (1975 to 2020) | +146.8% |
| Population change (2000 to 2020) | +34.5% |
| Median Age | 24.7 years (Male: 24.8, Female: 24.6) |
| Neighborhoods | Ciloto, Cipanas, Kalideres, Pasar Minggu, Kebon Jeruk, Penjaringan |
| Local Time | |
| Timezone | Western Indonesia Time |
| Lat & Lng | -6.71083, 107.00028 |
| Postal Codes | 16750 |
Map of Puncak
Interactive Map
Puncak Population
Years 1975 to 2020
| Data | 1975 | 1990 | 2000 | 2015 | 2020 |
|---|---|---|---|---|---|
| Population | 104,206 | 124,216 | 191,241 | 245,499 | 257,213 |
| Population Density | 1,408.2 / km² | 1,678.6 / km² | 2,584.3 / km² | 3,317.6 / km² | 3,475.9 / km² |
Puncak Population change from 2000 to 2015
Increase of 28.4% from year 2000 to 2015
| Location | Change since 1975 | Change since 1990 | Change since 2000 |
|---|---|---|---|
| Puncak | +135.6% | +97.6% | +28.4% |
| West Java | +216.6% | +80.7% | +44.2% |
| Indonesia | +96.9% | +41.9% | +21.7% |
Puncak Median Age
Median Age: 24.7 years
| Location | Median Age | Median Age (Female) | Median Age (Male) |
|---|---|---|---|
| Puncak | 24.7 yrs | 24.6 yrs | 24.8 yrs |
| West Java | 26.2 yrs | 26.2 yrs | 26.2 yrs |
| Indonesia | 27.2 yrs | 27.5 yrs | 26.9 yrs |
Puncak Population Density
Population Density: 3,476 / km²
| Location | Population | Area | Density |
|---|---|---|---|
| Puncak | 257,213 | 74 km² | 3,476 / km² |
| West Java | 44,507 | 53.6 km² | 831 / km² |
| Indonesia | 252.8 million | 1,893,657.8 km² | 134 / km² |
Puncak Historical and Projected Population
Estimated Population from 1200 to 2100
- JRC (European Commission's Joint Research Centre) work on the GHS built-up grid
- CIESIN (Center for International Earth Science Information Network)
- [Link] Klein Goldewijk, K., Beusen, A., Doelman, J., and Stehfest, E.: Anthropogenic land use estimates for the Holocene – HYDE 3.2, Earth Syst. Sci. Data, 9, 927–953, https://doi.org/10.5194/essd-9-927-2017, 2017.
Neighborhoods in Puncak
Percentage of businesses by neighborhood in Puncak
Price Distribution
Business distribution by price for Puncak
Human Development Index (HDI)
Statistic composite index of life expectancy, education, and per capita income.
Puncak CO2 Emissions
Carbon Dioxide (CO2) Emissions Per Capita in Tonnes Per Year
| Location | CO2 Emissions | CO2 Emissions Per Capita | CO2 Emissions Intensity |
|---|---|---|---|
| Puncak | 555,885 tn | 2.16 tn | 7,512 tons/km² |
| West Java | 91,689 tn | 2.06 tn | 1,711.5 tons/km² |
| Indonesia | 478,610,416 tn | 1.89 tn | 252.7 tons/km² |
| 2013 CO2 emissions (tonnes/year) | 555,885 tn |
| 2013 CO2 emissions (tonnes/year) per capita | 2.16 tn |
| 2013 CO2 emissions intensity (tonnes/km²/year) | 7,512 tons/km² |
Natural Hazards Risk
Relative risk out of 10
| Hazard | Risk Level |
|---|---|
| Drought | Medium (5) |
| Flood | High (10) |
| Earthquake | Medium (7) |
| Landslide | High (9) |
| Volcano | High (9) |
* Risk, particularly concerning flood or landslide, may not be for the entire area.
- Dilley, M., R.S. Chen, U. Deichmann, A.L. Lerner-Lam, M. Arnold, J. Agwe, P. Buys, O. Kjekstad, B. Lyon, and G. Yetman. 2005. Natural Disaster Hotspots: A Global Risk Analysis. Washington, D.C.: World Bank. https://doi.org/10.1596/0-8213-5930-4.
- Center for Hazards and Risk Research - CHRR - Columbia University, Center for International Earth Science Information Network - CIESIN - Columbia University, and Norwegian Geotechnical Institute - NGI. 2005. Global Landslide Hazard Distribution. Palisades, NY: NASA Socioeconomic Data and Applications Center (SEDAC). https://doi.org/10.7927/H4P848VZ.
- Center for Hazards and Risk Research - CHRR - Columbia University, Center for International Earth Science Information Network - CIESIN - Columbia University, and International Research Institute for Climate and Society - IRI - Columbia University. 2005. Global Drought Hazard Frequency and Distribution. Palisades, NY: NASA Socioeconomic Data and Applications Center (SEDAC). https://doi.org/10.7927/H4VX0DFT.
- Center for Hazards and Risk Research - CHRR - Columbia University, Center for International Earth Science Information Network - CIESIN - Columbia University. 2005. Global Flood Hazard Frequency and Distribution. Palisades, NY: NASA Socioeconomic Data and Applications Center (SEDAC). https://doi.org/10.7927/H4668B3D.
- Center for Hazards and Risk Research - CHRR - Columbia University, Center for International Earth Science Information Network - CIESIN - Columbia University. 2005. Global Volcano Hazard Frequency and Distribution. Palisades, NY: NASA Socioeconomic Data and Applications Center (SEDAC). https://doi.org/10.7927/H4BR8Q45.
- Center for Hazards and Risk Research - CHRR - Columbia University, Center for International Earth Science Information Network - CIESIN - Columbia University. 2005. Global Earthquake Hazard Distribution - Peak Ground Acceleration. Palisades, NY: NASA Socioeconomic Data and Applications Center (SEDAC). https://doi.org/10.7927/H4BZ63ZS.
Recent Nearby Earthquakes
Magnitude 3.0 and greater
| Date▼ | Time↕ | Magnitude↕ | Distance↕ | Depth↕ | Location↕ | Link |
|---|---|---|---|---|---|---|
| 3/19/19 | 5:04 AM | 4.5 | 23.6 km | 155,050 m | 9km NNW of Cibeber, Indonesia | usgs.gov |
| 3/27/18 | 8:57 PM | 4.5 | 57.4 km | 139,150 m | 0km NE of Serpong, Indonesia | usgs.gov |
| 12/12/17 | 2:23 AM | 5 | 47.1 km | 100,750 m | 1km SSW of Ciodeng, Indonesia | usgs.gov |
| 10/11/17 | 4:30 PM | 4.3 | 61.5 km | 95,750 m | 2km ESE of Cigaru, Indonesia | usgs.gov |
| 5/10/17 | 5:46 PM | 4.6 | 50.6 km | 121,110 m | 5km E of Sidoger Lebak, Indonesia | usgs.gov |
| 3/6/17 | 8:11 PM | 4.3 | 48.5 km | 61,550 m | 2km ESE of Cimapag, Indonesia | usgs.gov |
| 12/13/16 | 11:28 AM | 4.5 | 24.5 km | 123,640 m | 9km SSE of Cicurug, Indonesia | usgs.gov |
| 8/28/16 | 6:47 AM | 4.3 | 43.6 km | 96,480 m | 1km E of Cilandak, Indonesia | usgs.gov |
| 8/25/16 | 3:06 AM | 4.3 | 29.7 km | 178,370 m | 7km WSW of Sukabumi, Indonesia | usgs.gov |
| 7/24/16 | 4:56 PM | 4.2 | 60.2 km | 134,550 m | 5km N of Nagrak, Indonesia | usgs.gov |
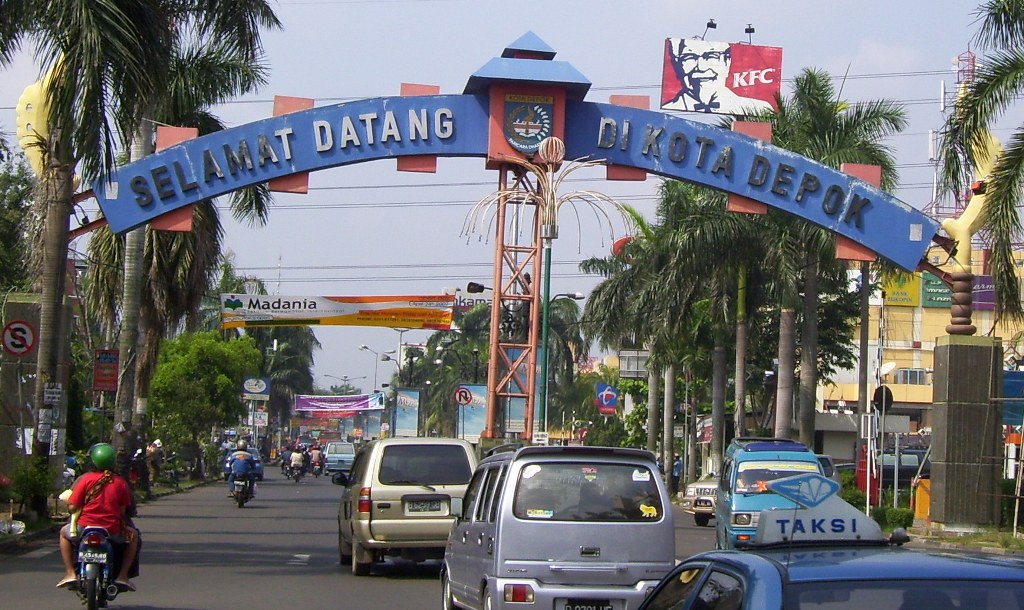
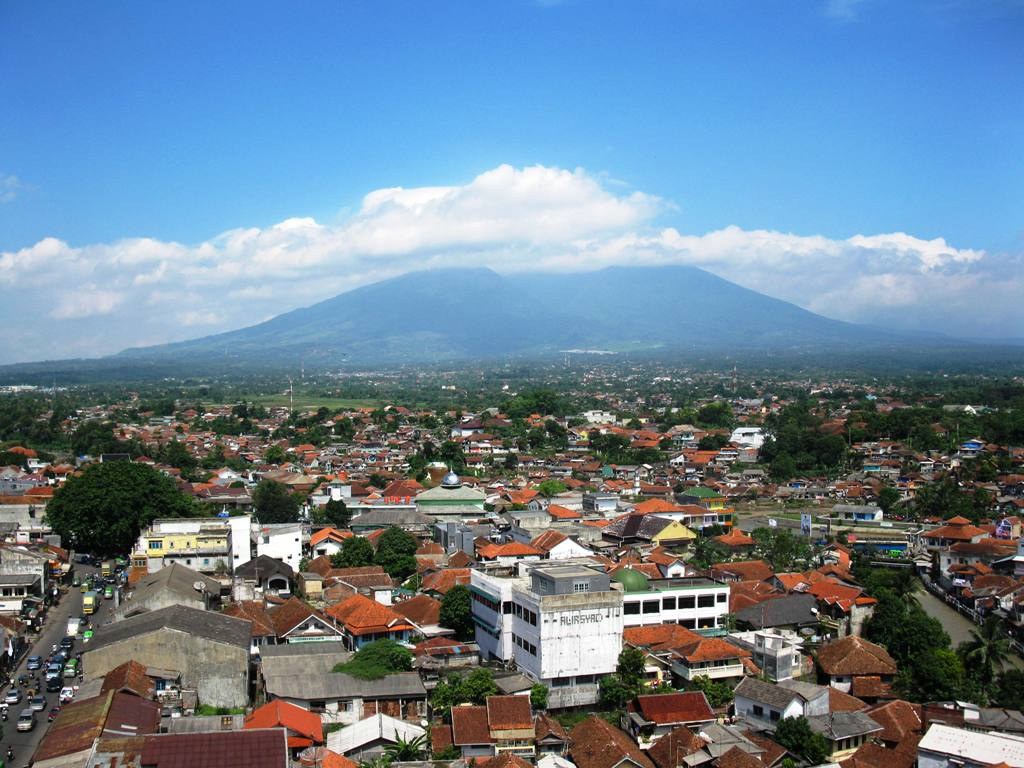
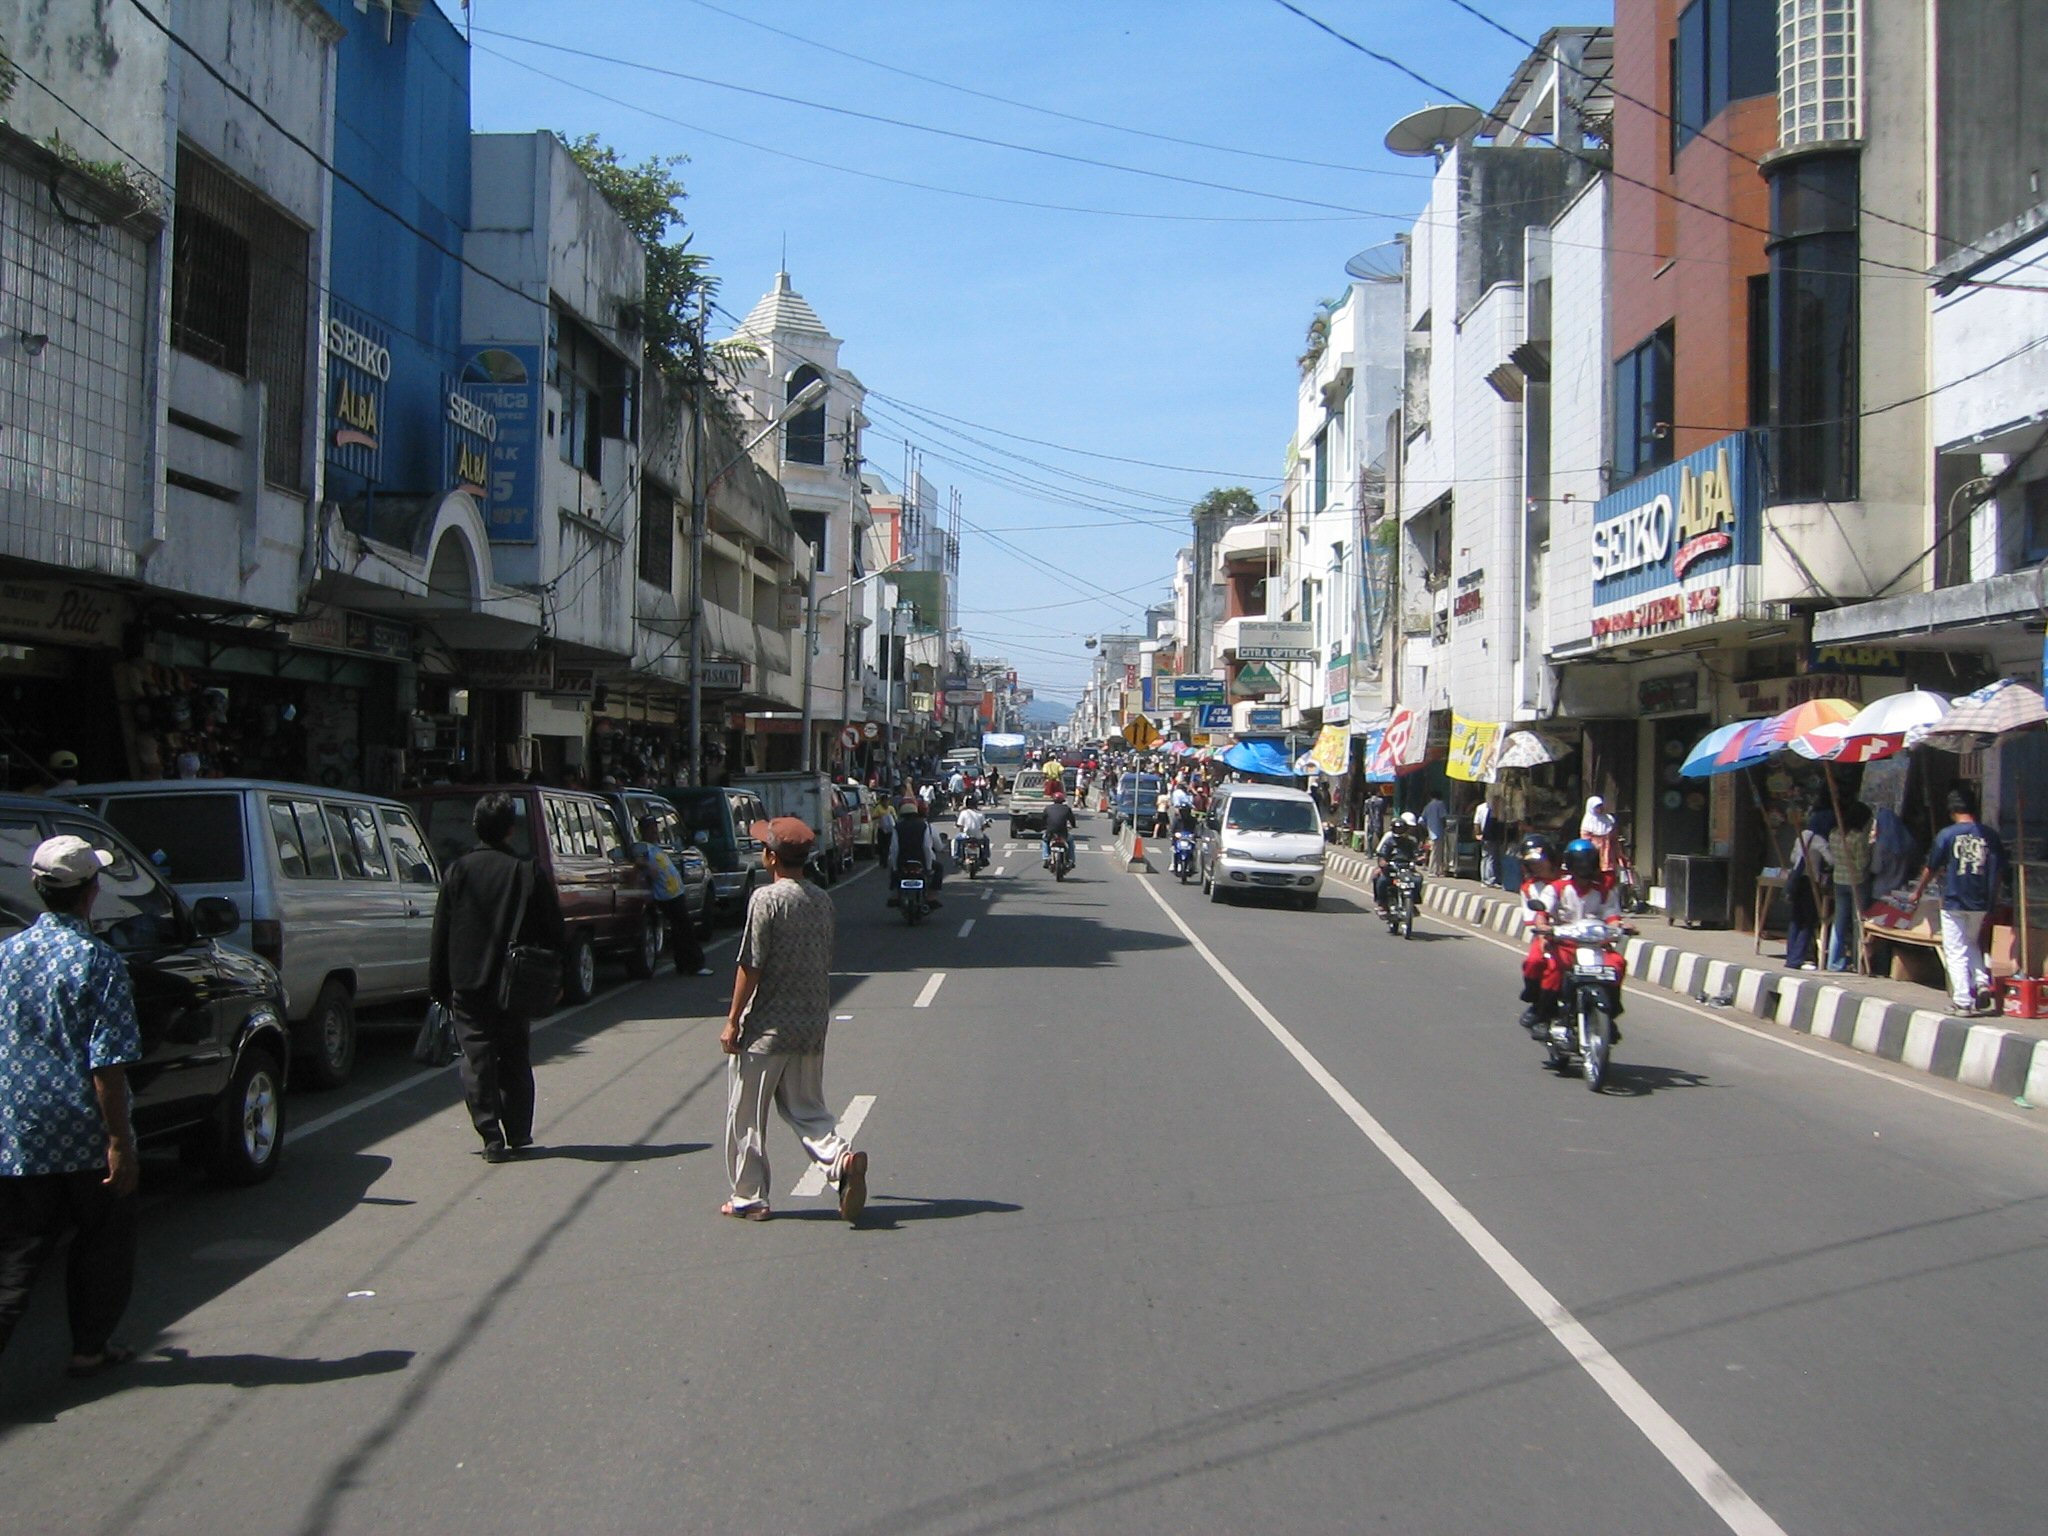
Puncak
Puncak or Puncak Pass (Indonesian for "top" or "peak") is a mountain pass in West Java, Indonesia. The pass connects the city of Bogor and Bandung, and is spread within the regencies of Bogor, Cianjur, and Sukabumi. The area is a popular area for tou..
Puncak Wikipedia Page
About Our Data
The data on this page is estimated using a number of publicly available tools and resources. It is provided without warranty, and could contain inaccuracies. Use at your own risk.