Categories in Tondano
Industries
Business Distribution by Industry in Tondano
| Industry Description | Number of Establishments |
|---|---|
| Shopping | 333 |
| Restaurants | 261 |
| Other accommodation | 166 |
| Religion | 157 |
| Cafes | 132 |
| Education | 117 |
| Churches | 103 |
| Travel and transportation | 80 |
| Grocery stores and supermarkets | 70 |
| Public administration | 57 |
| Beauty salons | 51 |
| Clothing stores | 50 |
| Corporate management | 43 |
Tondano Facts
| Area | 193.4 km² |
| Population | 131,835 |
| Male Population | 67,391 (51.1%) |
| Female Population | 64,444 (48.9%) |
| Population change (1975 to 2020) | +263.7% |
| Population change (2000 to 2020) | +49.7% |
| Median Age | 31.3 years (Male: 30.9, Female: 31.8) |
| Area Codes | 4 |
| Neighborhoods | Kembuan, Tondano Utara, Toulour, Tondano Timur, Tondano, Ranowangko, Tondano Timur, Kembuan, Tondano |
| Local Time | |
| Timezone | Central Indonesia Time |
| Lat & Lng | 1.30540, 124.91261 |
| Postal Codes | 95611, 95612, 95613, 95614, 95615, More |
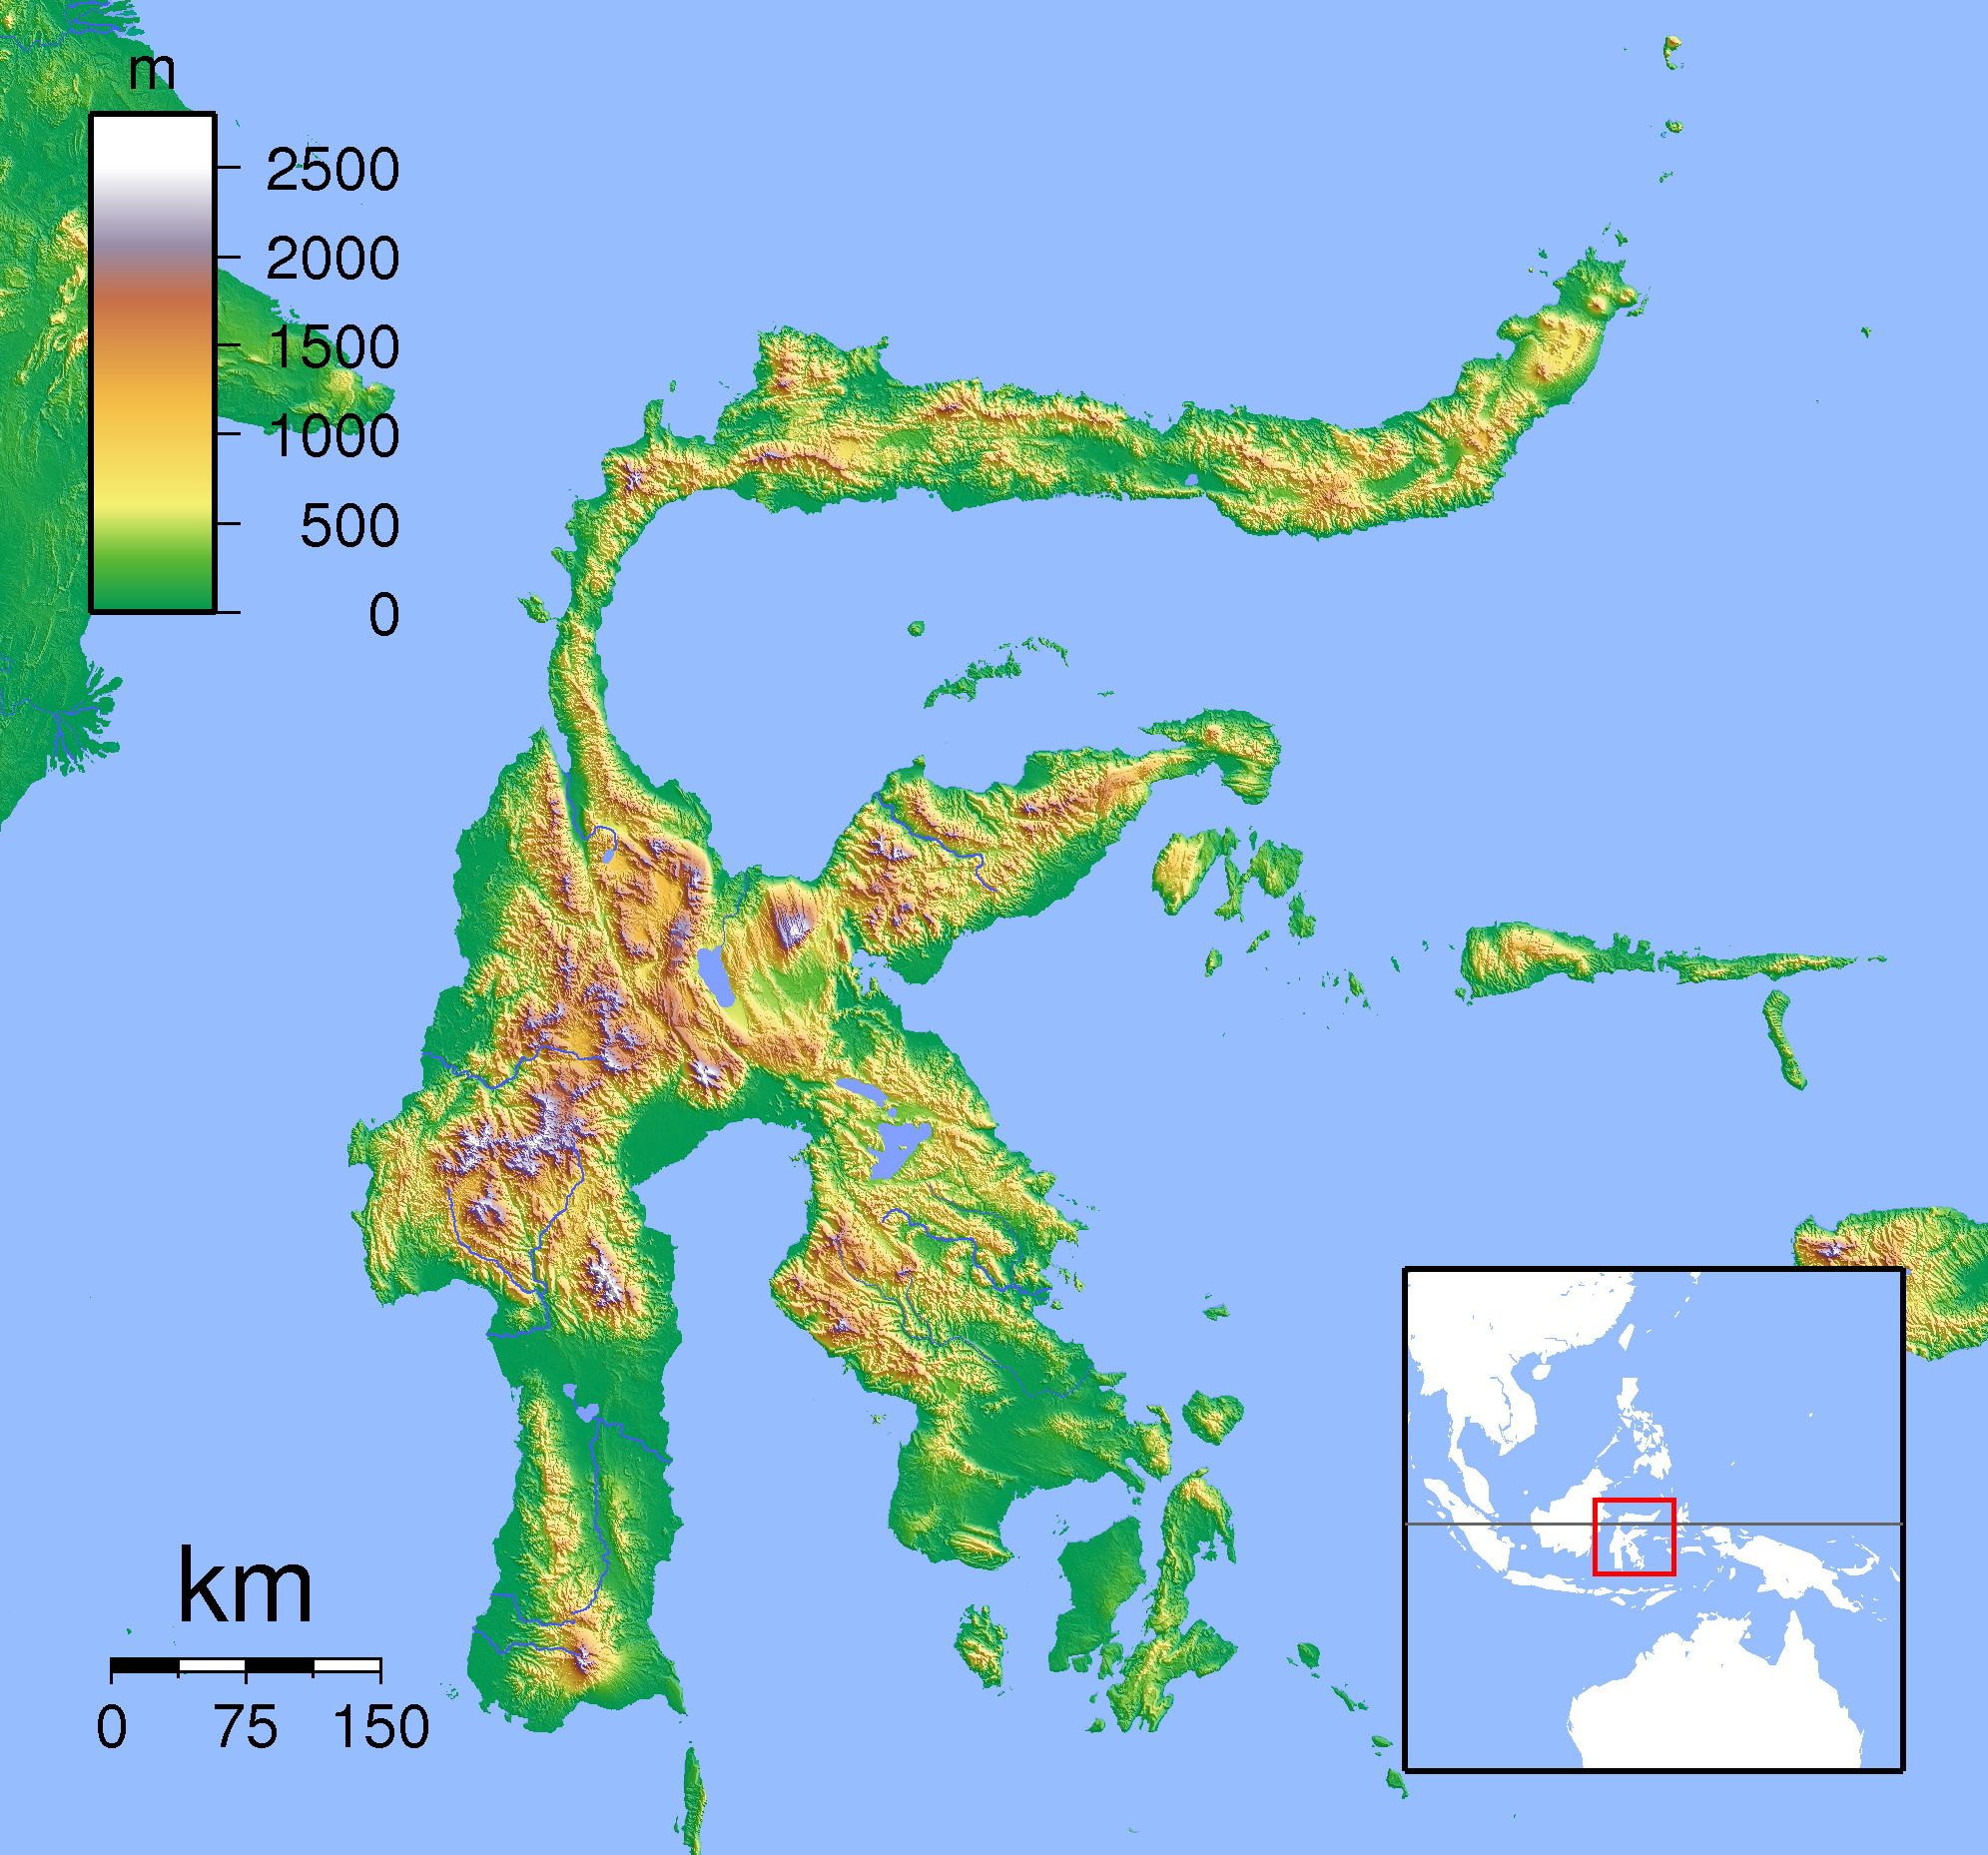
Map of Tondano
Interactive Map
Tondano Population
Years 1975 to 2020
| Data | 1975 | 1990 | 2000 | 2015 | 2020 |
|---|---|---|---|---|---|
| Population | 36,250 | 65,831 | 88,053 | 127,225 | 131,835 |
| Population Density | 187.5 / km² | 340.4 / km² | 455.3 / km² | 657.9 / km² | 681.8 / km² |
Tondano Population change from 2000 to 2015
Increase of 44.5% from year 2000 to 2015
| Location | Change since 1975 | Change since 1990 | Change since 2000 |
|---|---|---|---|
| Tondano | +251% | +93.3% | +44.5% |
| North Sulawesi | +161% | +67.6% | +34.2% |
| Indonesia | +96.9% | +41.9% | +21.7% |
Tondano Median Age
Median Age: 31.3 years
| Location | Median Age | Median Age (Female) | Median Age (Male) |
|---|---|---|---|
| Tondano | 31.3 yrs | 31.8 yrs | 30.9 yrs |
| North Sulawesi | 29.1 yrs | 29.5 yrs | 28.7 yrs |
| Indonesia | 27.2 yrs | 27.5 yrs | 26.9 yrs |
Tondano Population Density
Population Density: 682 / km²
| Location | Population | Area | Density |
|---|---|---|---|
| Tondano | 131,835 | 193.4 km² | 682 / km² |
| North Sulawesi | 2.4 million | 14,665.5 km² | 161 / km² |
| Indonesia | 252.8 million | 1,893,657.8 km² | 134 / km² |
Tondano Historical and Projected Population
Estimated Population from 1860 to 2100
- JRC (European Commission's Joint Research Centre) work on the GHS built-up grid
- CIESIN (Center for International Earth Science Information Network)
- [Link] Klein Goldewijk, K., Beusen, A., Doelman, J., and Stehfest, E.: Anthropogenic land use estimates for the Holocene – HYDE 3.2, Earth Syst. Sci. Data, 9, 927–953, https://doi.org/10.5194/essd-9-927-2017, 2017.
Neighborhoods in Tondano
Percentage of businesses by neighborhood in Tondano
Area Codes
Percentage Area Codes used by businesses in Tondano
Price Distribution
Business distribution by price for Tondano
Human Development Index (HDI)
Statistic composite index of life expectancy, education, and per capita income.
Tondano CO2 Emissions
Carbon Dioxide (CO2) Emissions Per Capita in Tonnes Per Year
| Location | CO2 Emissions | CO2 Emissions Per Capita | CO2 Emissions Intensity |
|---|---|---|---|
| Tondano | 300,170 tn | 2.28 tn | 1,552.3 tons/km² |
| North Sulawesi | 4,296,994 tn | 1.82 tn | 293 tons/km² |
| Indonesia | 478,610,416 tn | 1.89 tn | 252.7 tons/km² |
| 2013 CO2 emissions (tonnes/year) | 300,170 tn |
| 2013 CO2 emissions (tonnes/year) per capita | 2.28 tn |
| 2013 CO2 emissions intensity (tonnes/km²/year) | 1,552.3 tons/km² |
Natural Hazards Risk
Relative risk out of 10
| Hazard | Risk Level |
|---|---|
| Drought | High (7.1) |
| Flood | Medium (4) |
| Earthquake | Medium (5.5) |
| Landslide | High (8) |
| Volcano | High (9) |
* Risk, particularly concerning flood or landslide, may not be for the entire area.
- Dilley, M., R.S. Chen, U. Deichmann, A.L. Lerner-Lam, M. Arnold, J. Agwe, P. Buys, O. Kjekstad, B. Lyon, and G. Yetman. 2005. Natural Disaster Hotspots: A Global Risk Analysis. Washington, D.C.: World Bank. https://doi.org/10.1596/0-8213-5930-4.
- Center for Hazards and Risk Research - CHRR - Columbia University, Center for International Earth Science Information Network - CIESIN - Columbia University, and Norwegian Geotechnical Institute - NGI. 2005. Global Landslide Hazard Distribution. Palisades, NY: NASA Socioeconomic Data and Applications Center (SEDAC). https://doi.org/10.7927/H4P848VZ.
- Center for Hazards and Risk Research - CHRR - Columbia University, Center for International Earth Science Information Network - CIESIN - Columbia University, and International Research Institute for Climate and Society - IRI - Columbia University. 2005. Global Drought Hazard Frequency and Distribution. Palisades, NY: NASA Socioeconomic Data and Applications Center (SEDAC). https://doi.org/10.7927/H4VX0DFT.
- Center for Hazards and Risk Research - CHRR - Columbia University, Center for International Earth Science Information Network - CIESIN - Columbia University. 2005. Global Flood Hazard Frequency and Distribution. Palisades, NY: NASA Socioeconomic Data and Applications Center (SEDAC). https://doi.org/10.7927/H4668B3D.
- Center for Hazards and Risk Research - CHRR - Columbia University, Center for International Earth Science Information Network - CIESIN - Columbia University. 2005. Global Volcano Hazard Frequency and Distribution. Palisades, NY: NASA Socioeconomic Data and Applications Center (SEDAC). https://doi.org/10.7927/H4BR8Q45.
- Center for Hazards and Risk Research - CHRR - Columbia University, Center for International Earth Science Information Network - CIESIN - Columbia University. 2005. Global Earthquake Hazard Distribution - Peak Ground Acceleration. Palisades, NY: NASA Socioeconomic Data and Applications Center (SEDAC). https://doi.org/10.7927/H4BZ63ZS.
Recent Nearby Earthquakes
Magnitude 3.0 and greater
| Date▼ | Time↕ | Magnitude↕ | Distance↕ | Depth↕ | Location↕ | Link |
|---|---|---|---|---|---|---|
| 4/18/19 | 9:31 PM | 4.5 | 52.7 km | 170,050 m | 25km N of Bitung, Indonesia | usgs.gov |
| 10/13/18 | 4:34 AM | 5.2 | 49.9 km | 97,150 m | 16km ENE of Bitung, Indonesia | usgs.gov |
| 7/13/18 | 2:29 AM | 4.6 | 44.8 km | 227,990 m | 36km W of Tomohon, Indonesia | usgs.gov |
| 4/2/18 | 7:23 PM | 4.6 | 37.4 km | 193,710 m | 17km NNW of Laikit, Laikit II (Dimembe), Indonesia | usgs.gov |
| 8/21/17 | 11:31 PM | 4.5 | 27.6 km | 134,190 m | 27km S of Tondano, Indonesia | usgs.gov |
| 10/10/16 | 8:24 AM | 4.1 | 36.7 km | 550,800 m | 15km N of Manado, Indonesia | usgs.gov |
| 9/27/16 | 9:35 AM | 4.1 | 14.8 km | 35,000 m | 6km WNW of Tomohon, Indonesia | usgs.gov |
| 7/27/16 | 7:16 PM | 4.5 | 50.7 km | 232,880 m | 29km NNW of Manado, Indonesia | usgs.gov |
| 7/27/16 | 9:53 AM | 4.2 | 53.5 km | 234,150 m | 42km NNE of Poigar, Indonesia | usgs.gov |
| 6/1/16 | 7:12 PM | 4.2 | 40.7 km | 153,380 m | 19km N of Manado, Indonesia | usgs.gov |

About Our Data
The data on this page is estimated using a number of publicly available tools and resources. It is provided without warranty, and could contain inaccuracies. Use at your own risk.