Categories in Bat Yam
Industries
Business Distribution by Industry in Bat Yam
| Industry Description | Number of Establishments | Average Age of Business |
|---|---|---|
| Restaurants | 418 | — |
| Grocery stores and supermarkets | 367 | — |
| Shopping | 236 | 28 years |
| Beauty salons | 235 | — |
| Real estate | 138 | — |
| Shopping other | 137 | — |
| Education | 128 | 18 years |
| Dentists | 119 | — |
| Clothing stores | 111 | — |
| Electronics stores | 109 | — |
| Car repair | 99 | 24 years |
| Corporate management | 96 | — |
Bat Yam Facts
| Area | 9.0 km² |
| Population | 113,902 |
| Male Population | 54,793 (48.1%) |
| Female Population | 59,109 (51.9%) |
| Population change (1975 to 2020) | +117.4% |
| Population change (2000 to 2020) | +30.4% |
| Median Age | 36.9 years (Male: 35, Female: 38.9) |
| Area Codes | 3 |
| Neighborhoods | Ajami - Giv'at Aliya, Yad Eliyahu, Lev HaIr Tzafon, Lev HaIr, HaTzafon HaYashan - Tzafon |
| Local Time | |
| Timezone | Israel Daylight Time |
| Lat & Lng | 32.02379, 34.75185 |
| Postal Codes | 59100, 59101, 59102, 59104, 59105, More |
Map of Bat Yam
Interactive Map
Bat Yam Population
Years 1975 to 2020
| Data | 1975 | 1990 | 2000 | 2015 | 2020 |
|---|---|---|---|---|---|
| Population | 52,391 | 70,373 | 87,380 | 105,419 | 113,902 |
| Population Density | 5,821.2 / km² | 7,819.2 / km² | 9,708.9 / km² | 11,713.2 / km² | 12,655.8 / km² |
Bat Yam Population change from 2000 to 2015
Increase of 20.6% from year 2000 to 2015
| Location | Change since 1975 | Change since 1990 | Change since 2000 |
|---|---|---|---|
| Bat Yam | +101.2% | +49.8% | +20.6% |
| Tel Aviv District | +93.2% | +53.9% | +22% |
| Israel | +141.5% | +78.8% | +33.8% |
Bat Yam Median Age
Median Age: 36.9 years
| Location | Median Age | Median Age (Female) | Median Age (Male) |
|---|---|---|---|
| Bat Yam | 36.9 yrs | 38.9 yrs | 35 yrs |
| Tel Aviv District | 34 yrs | 35.2 yrs | 32.8 yrs |
| Israel | 29.5 yrs | 30.6 yrs | 28.5 yrs |
Bat Yam Population Density
Population Density: 12,656 / km²
| Location | Population | Area | Density |
|---|---|---|---|
| Bat Yam | 113,902 | 9 km² | 12,656 / km² |
| Tel Aviv District | 1.4 million | 172.1 km² | 7,855 / km² |
| Israel | 8.3 million | 22,078 km² | 374 / km² |
Bat Yam Historical and Projected Population
Estimated Population from 0 to 2100
- JRC (European Commission's Joint Research Centre) work on the GHS built-up grid
- CIESIN (Center for International Earth Science Information Network)
- [Link] Klein Goldewijk, K., Beusen, A., Doelman, J., and Stehfest, E.: Anthropogenic land use estimates for the Holocene – HYDE 3.2, Earth Syst. Sci. Data, 9, 927–953, https://doi.org/10.5194/essd-9-927-2017, 2017.
Neighborhoods in Bat Yam
Percentage of businesses by neighborhood in Bat Yam
Area Codes
Percentage Area Codes used by businesses in Bat Yam
Price Distribution
Business distribution by price for Bat Yam
Human Development Index (HDI)
Statistic composite index of life expectancy, education, and per capita income.
Bat Yam CO2 Emissions
Carbon Dioxide (CO2) Emissions Per Capita in Tonnes Per Year
| Location | CO2 Emissions | CO2 Emissions Per Capita | CO2 Emissions Intensity |
|---|---|---|---|
| Bat Yam | 1,330,088 tn | 11.68 tn | 147,787.6 tons/km² |
| Tel Aviv District | 15,790,683 tn | 11.68 tn | 91,727.9 tons/km² |
| Israel | 81,985,471 tn | 9.92 tn | 3,713.4 tons/km² |
| 2013 CO2 emissions (tonnes/year) | 1,330,088 tn |
| 2013 CO2 emissions (tonnes/year) per capita | 11.68 tn |
| 2013 CO2 emissions intensity (tonnes/km²/year) | 147,787.6 tons/km² |
Natural Hazards Risk
Relative risk out of 10
| Hazard | Risk Level |
|---|---|
| Flood | Medium (4) |
| Earthquake | Medium (5.7) |
* Risk, particularly concerning flood or landslide, may not be for the entire area.
- Dilley, M., R.S. Chen, U. Deichmann, A.L. Lerner-Lam, M. Arnold, J. Agwe, P. Buys, O. Kjekstad, B. Lyon, and G. Yetman. 2005. Natural Disaster Hotspots: A Global Risk Analysis. Washington, D.C.: World Bank. https://doi.org/10.1596/0-8213-5930-4.
- Center for Hazards and Risk Research - CHRR - Columbia University, Center for International Earth Science Information Network - CIESIN - Columbia University. 2005. Global Flood Hazard Frequency and Distribution. Palisades, NY: NASA Socioeconomic Data and Applications Center (SEDAC). https://doi.org/10.7927/H4668B3D.
- Center for Hazards and Risk Research - CHRR - Columbia University, Center for International Earth Science Information Network - CIESIN - Columbia University. 2005. Global Earthquake Hazard Distribution - Peak Ground Acceleration. Palisades, NY: NASA Socioeconomic Data and Applications Center (SEDAC). https://doi.org/10.7927/H4BZ63ZS.
Recent Nearby Earthquakes
Magnitude 3.0 and greater
| Date▼ | Time↕ | Magnitude↕ | Distance↕ | Depth↕ | Location↕ | Link |
|---|---|---|---|---|---|---|
| 7/30/15 | 2:39 AM | 4.2 | 97.8 km | 13,000 m | 24km NNE of `En Boqeq, Israel | usgs.gov |
| 8/7/11 | 8:52 AM | 4.1 | 65.7 km | 31,000 m | Dead Sea region | usgs.gov |
| 12/2/07 | 7:38 AM | 4 | 84.7 km | 10,000 m | Dead Sea region | usgs.gov |
| 11/23/07 | 10:19 PM | 4.4 | 25.4 km | 11,000 m | Dead Sea region | usgs.gov |
| 11/20/07 | 11:21 PM | 3.2 | 88 km | 5,000 m | Dead Sea region | usgs.gov |
| 11/20/07 | 9:18 AM | 4.6 | 85.1 km | 10,000 m | Dead Sea region | usgs.gov |
| 11/18/06 | 2:57 AM | 3.1 | 66.7 km | 10,000 m | Dead Sea region | usgs.gov |
| 9/17/06 | 8:22 AM | 4 | 67.8 km | 1,000 m | Dead Sea region | usgs.gov |
| 9/9/06 | 4:58 AM | 4.5 | 69.7 km | 1,000 m | Dead Sea region | usgs.gov |
| 10/3/05 | 4:05 AM | 4.4 | 76.2 km | 10,000 m | Dead Sea region | usgs.gov |
Bat Yam
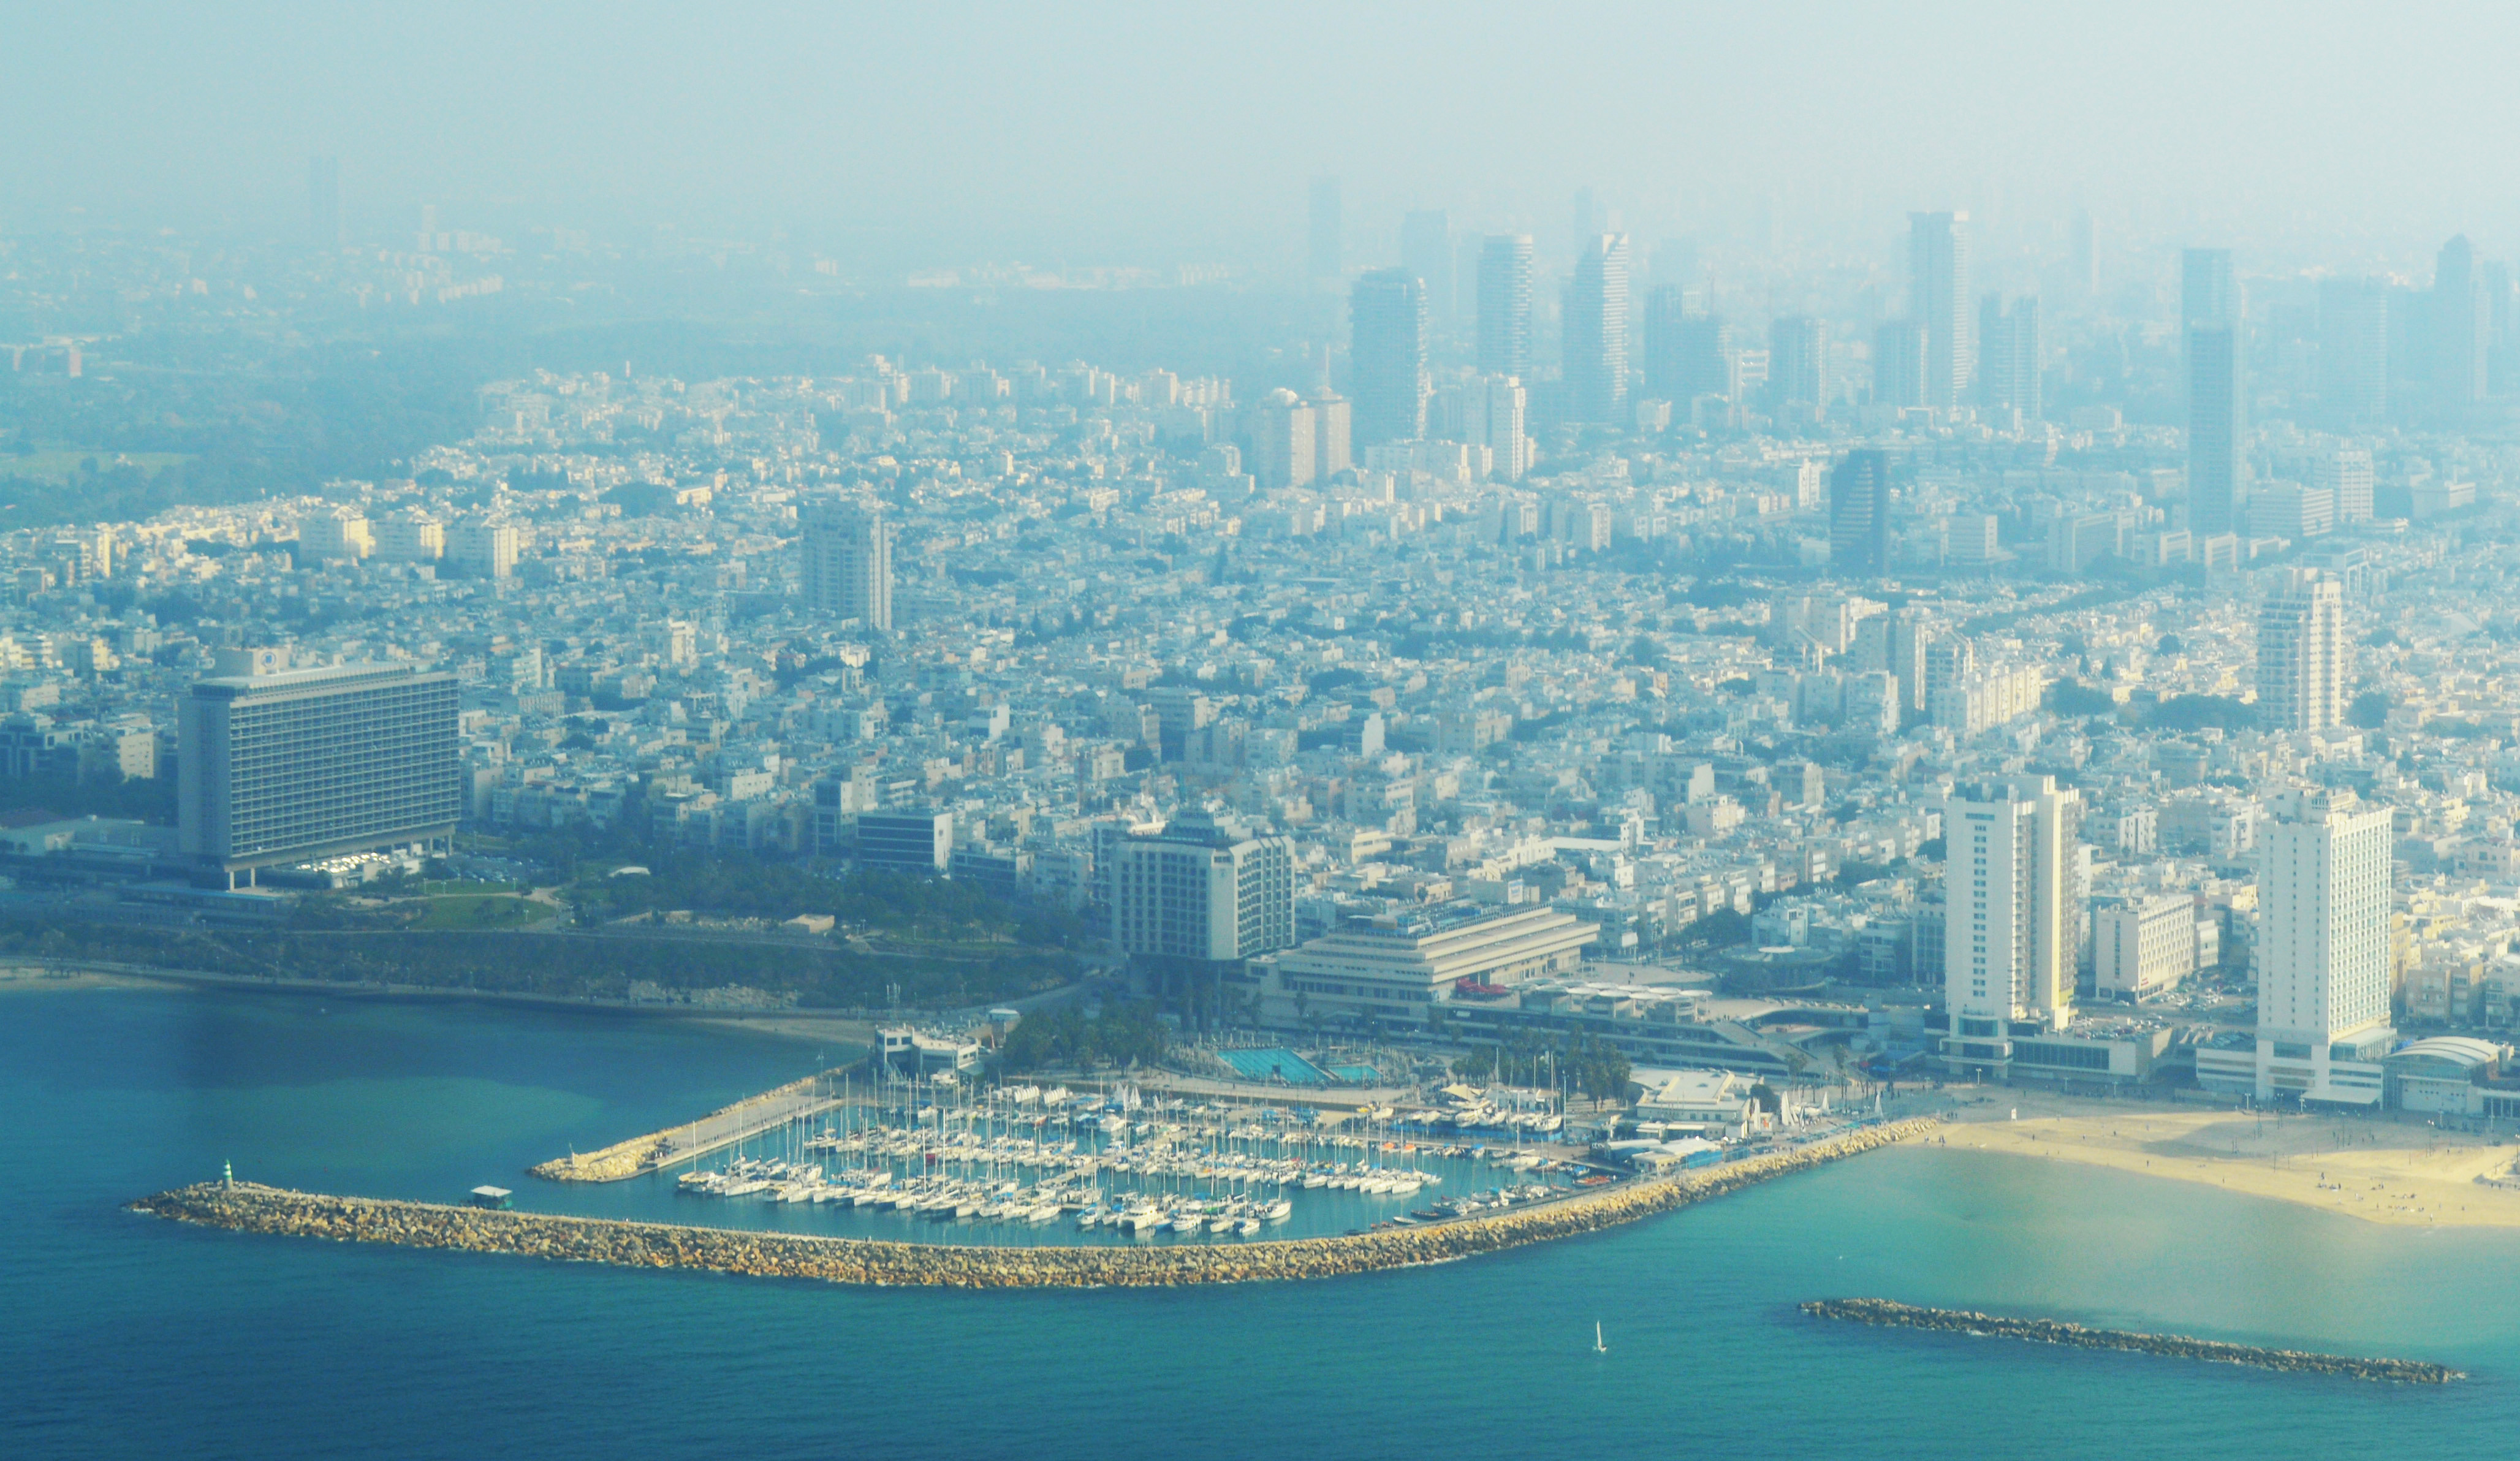
Bat Yam (Hebrew: בַּת יָם (audio) ) is a city located on Israel's Mediterranean Sea coast, on the central coastal strip, just south of Tel Aviv. Part of the Gush Dan metropolitan area in Tel Aviv District, the city had a population of 128,498 in 201..
Bat Yam Wikipedia Page


About Our Data
The data on this page is estimated using a number of publicly available tools and resources. It is provided without warranty, and could contain inaccuracies. Use at your own risk.