Categories in Dimona
Industries
Business Distribution by Industry in Dimona
| Industry Description | Number of Establishments |
|---|---|
| Restaurants | 70 |
| Buses and trains | 40 |
| Education | 33 |
| Grocery stores and supermarkets | 32 |
| Shopping | 31 |
| Synagogues | 24 |
| Research, development and testing services | 21 |
| Public parks | 20 |
| Religion | 20 |
Dimona Facts
| Area | 11.4 km² |
| Population | 28,021 |
| Male Population | 13,880 (49.5%) |
| Female Population | 14,141 (50.5%) |
| Population change (1975 to 2020) | +46.1% |
| Population change (2000 to 2020) | +26.0% |
| Median Age | 26 years (Male: 24.8, Female: 27.2) |
| Area Codes | 8 |
| Neighborhoods | Mamshit, Zona 10, Pirhei Artsenu |
| Local Time | |
| Timezone | Israel Daylight Time |
| Lat & Lng | 31.07127, 35.03370 |
| Postal Codes | 86100, 86101, 86103, 86104, 86106, More |
Map of Dimona
Interactive Map
Dimona Population
Years 1975 to 2020
| Data | 1975 | 1990 | 2000 | 2015 | 2020 |
|---|---|---|---|---|---|
| Population | 19,182 | 19,133 | 22,247 | 24,880 | 28,021 |
| Population Density | 1,677.1 / km² | 1,672.8 / km² | 1,945.1 / km² | 2,175.3 / km² | 2,449.9 / km² |
Dimona Population change from 2000 to 2015
Increase of 11.8% from year 2000 to 2015
| Location | Change since 1975 | Change since 1990 | Change since 2000 |
|---|---|---|---|
| Dimona | +29.7% | +30% | +11.8% |
| Southern District (Israel) | +134.7% | +73.8% | +31% |
| Israel | +141.5% | +78.8% | +33.8% |
Dimona Median Age
Median Age: 26 years
| Location | Median Age | Median Age (Female) | Median Age (Male) |
|---|---|---|---|
| Dimona | 26 yrs | 27.2 yrs | 24.8 yrs |
| Southern District (Israel) | 27.7 yrs | 28.8 yrs | 26.7 yrs |
| Israel | 29.5 yrs | 30.6 yrs | 28.5 yrs |
Dimona Population Density
Population Density: 2,450 / km²
| Location | Population | Area | Density |
|---|---|---|---|
| Dimona | 28,021 | 11.4 km² | 2,450 / km² |
| Southern District (Israel) | 1.1 million | 14,450.3 km² | 78 / km² |
| Israel | 8.3 million | 22,078 km² | 374 / km² |
Dimona Historical and Projected Population
Estimated Population from 0 to 2100
- JRC (European Commission's Joint Research Centre) work on the GHS built-up grid
- CIESIN (Center for International Earth Science Information Network)
- [Link] Klein Goldewijk, K., Beusen, A., Doelman, J., and Stehfest, E.: Anthropogenic land use estimates for the Holocene – HYDE 3.2, Earth Syst. Sci. Data, 9, 927–953, https://doi.org/10.5194/essd-9-927-2017, 2017.
Postal Codes
Percentage of businesses by Postal Codes in Dimona
Price Distribution
Business distribution by price for Dimona
Human Development Index (HDI)
Statistic composite index of life expectancy, education, and per capita income.
Dimona CO2 Emissions
Carbon Dioxide (CO2) Emissions Per Capita in Tonnes Per Year
| Location | CO2 Emissions | CO2 Emissions Per Capita | CO2 Emissions Intensity |
|---|---|---|---|
| Dimona | 290,924 tn | 10.38 tn | 25,436 tons/km² |
| Southern District (Israel) | 11,654,295 tn | 10.35 tn | 806.5 tons/km² |
| Israel | 81,985,471 tn | 9.92 tn | 3,713.4 tons/km² |
| 2013 CO2 emissions (tonnes/year) | 290,924 tn |
| 2013 CO2 emissions (tonnes/year) per capita | 10.38 tn |
| 2013 CO2 emissions intensity (tonnes/km²/year) | 25,436 tons/km² |
Natural Hazards Risk
Relative risk out of 10
| Hazard | Risk Level |
|---|---|
| Drought | High (9) |
| Earthquake | Medium (6) |
* Risk, particularly concerning flood or landslide, may not be for the entire area.
- Dilley, M., R.S. Chen, U. Deichmann, A.L. Lerner-Lam, M. Arnold, J. Agwe, P. Buys, O. Kjekstad, B. Lyon, and G. Yetman. 2005. Natural Disaster Hotspots: A Global Risk Analysis. Washington, D.C.: World Bank. https://doi.org/10.1596/0-8213-5930-4.
- Center for Hazards and Risk Research - CHRR - Columbia University, Center for International Earth Science Information Network - CIESIN - Columbia University, and International Research Institute for Climate and Society - IRI - Columbia University. 2005. Global Drought Hazard Frequency and Distribution. Palisades, NY: NASA Socioeconomic Data and Applications Center (SEDAC). https://doi.org/10.7927/H4VX0DFT.
- Center for Hazards and Risk Research - CHRR - Columbia University, Center for International Earth Science Information Network - CIESIN - Columbia University. 2005. Global Earthquake Hazard Distribution - Peak Ground Acceleration. Palisades, NY: NASA Socioeconomic Data and Applications Center (SEDAC). https://doi.org/10.7927/H4BZ63ZS.
Recent Nearby Earthquakes
Magnitude 3.0 and greater
| Date▼ | Time↕ | Magnitude↕ | Distance↕ | Depth↕ | Location↕ | Link |
|---|---|---|---|---|---|---|
| 7/30/15 | 2:39 AM | 4.2 | 55.7 km | 13,000 m | 24km NNE of `En Boqeq, Israel | usgs.gov |
| 5/24/14 | 7:27 AM | 4.1 | 70.7 km | 20,000 m | 24km NW of Petra, Jordan | usgs.gov |
| 12/2/07 | 7:38 AM | 4 | 82.2 km | 10,000 m | Dead Sea region | usgs.gov |
| 11/23/07 | 10:19 PM | 4.4 | 87.9 km | 11,000 m | Dead Sea region | usgs.gov |
| 11/20/07 | 11:21 PM | 3.2 | 85.8 km | 5,000 m | Dead Sea region | usgs.gov |
| 11/20/07 | 9:18 AM | 4.6 | 84.1 km | 10,000 m | Dead Sea region | usgs.gov |
| 2/9/07 | 10:14 PM | 4.5 | 40.9 km | 15,000 m | Dead Sea region | usgs.gov |
| 2/9/07 | 10:12 PM | 4 | 51.7 km | 2,000 m | Dead Sea region | usgs.gov |
| 10/3/05 | 4:05 AM | 4.4 | 90.5 km | 10,000 m | Dead Sea region | usgs.gov |
| 3/15/04 | 11:49 PM | 4.3 | 58.5 km | 12,000 m | Dead Sea region | usgs.gov |
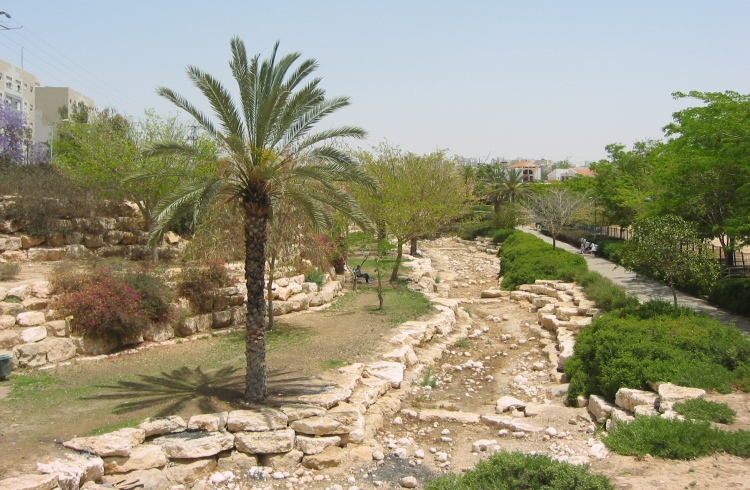
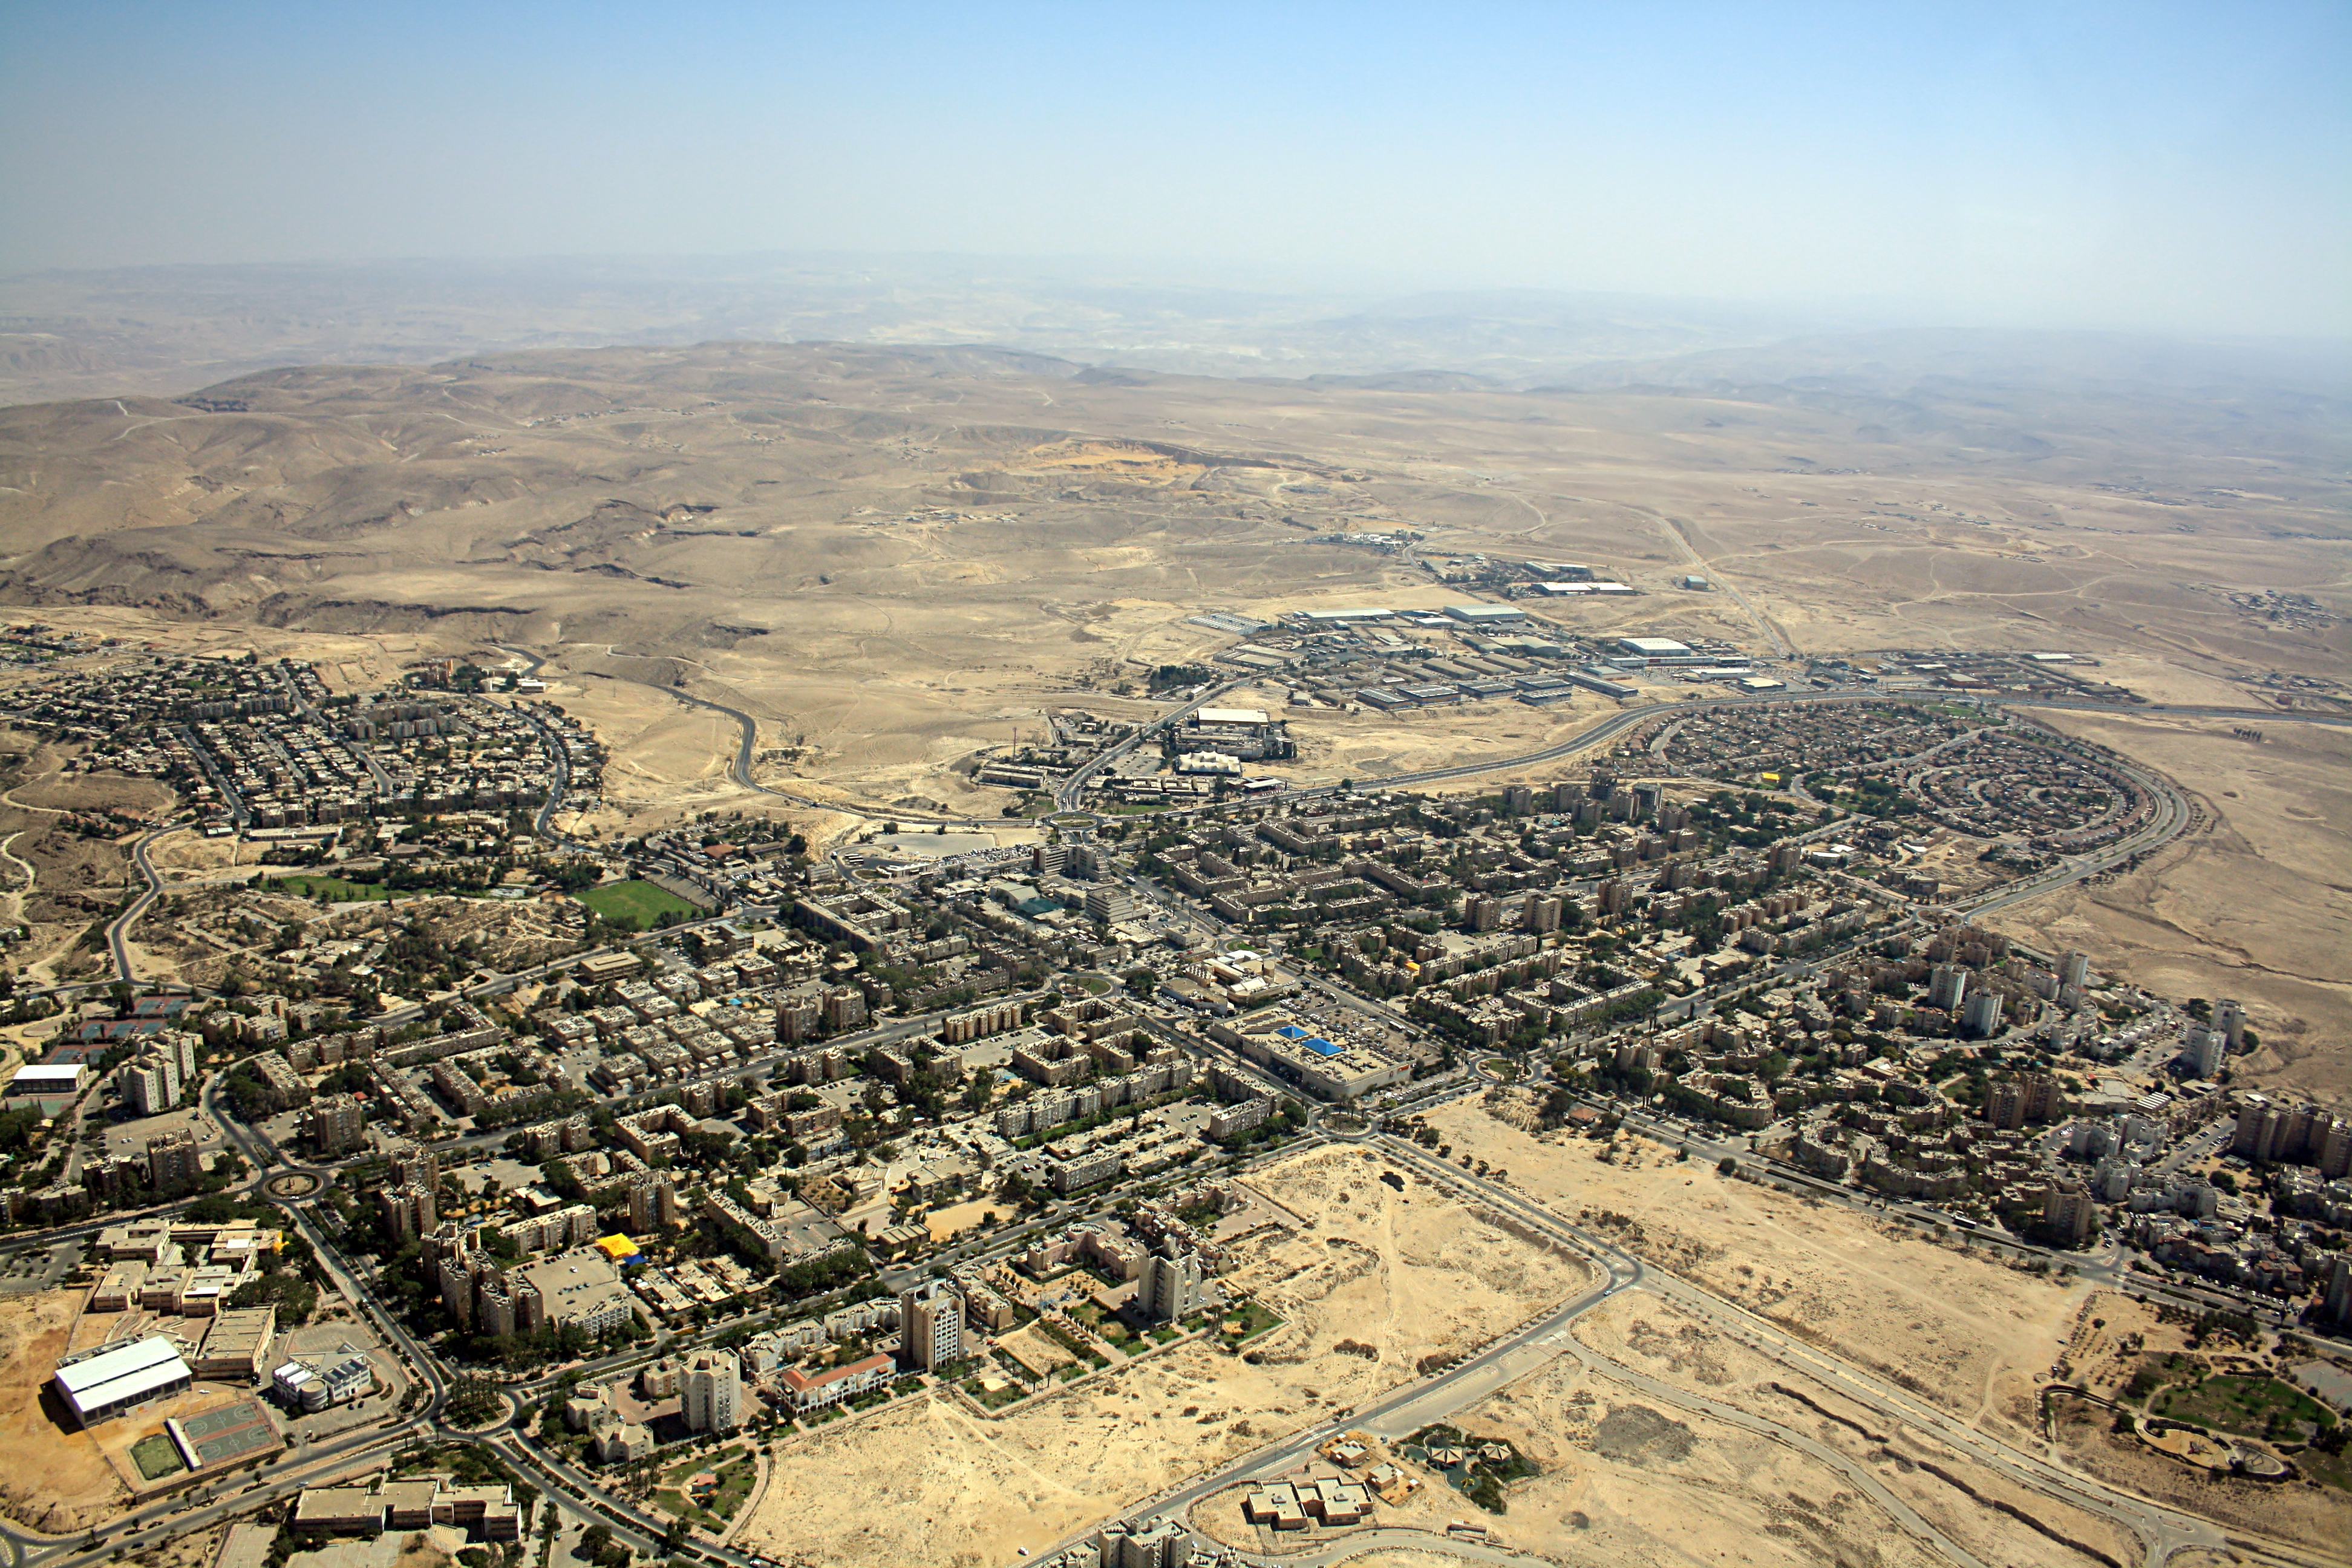
Dimona
Dimona (Hebrew: דִּימוֹנָה) is an Israeli city in the Negev desert, 36 kilometres (22 mi) to the south of Beersheba and 35 kilometres (22 mi) west of the Dead Sea above the Arava valley in the Southern District of Israel. Its population at the end of..
Dimona Wikipedia Page

About Our Data
The data on this page is estimated using a number of publicly available tools and resources. It is provided without warranty, and could contain inaccuracies. Use at your own risk.