Eitanim Facts
| Area | 0.1 km² |
| Population | 544 |
| Male Population | 270 (49.6%) |
| Female Population | 274 (50.4%) |
| Population change (1975 to 2020) | +253.2% |
| Population change (2000 to 2020) | +55.9% |
| Median Age | 23.8 years (Male: 23, Female: 24.7) |
| Area Codes | 2 |
| Local Time | |
| Timezone | Israel Daylight Time |
| Lat & Lng | 31.77893, 35.09574 |
| Postal Codes | 90972 |
Map of Eitanim
Interactive Map
Eitanim Population
Years 1975 to 2020
| Data | 1975 | 1990 | 2000 | 2015 | 2020 |
|---|---|---|---|---|---|
| Population | 154 | 215 | 349 | 497 | 544 |
| Population Density | 1,232 / km² | 1,720 / km² | 2,792 / km² | 3,976 / km² | 4,352 / km² |
Eitanim Population change from 2000 to 2015
Increase of 42.4% from year 2000 to 2015
| Location | Change since 1975 | Change since 1990 | Change since 2000 |
|---|---|---|---|
| Eitanim | +222.7% | +131.2% | +42.4% |
| Jerusalem District | +186.6% | +93.3% | +39.1% |
| Israel | +141.5% | +78.8% | +33.8% |
Eitanim Median Age
Median Age: 23.8 years
| Location | Median Age | Median Age (Female) | Median Age (Male) |
|---|---|---|---|
| Eitanim | 23.8 yrs | 24.7 yrs | 23 yrs |
| Jerusalem District | 23.3 yrs | 24.1 yrs | 22.5 yrs |
| Israel | 29.5 yrs | 30.6 yrs | 28.5 yrs |
Eitanim Population Density
Population Density: 4,352 / km²
| Location | Population | Area | Density |
|---|---|---|---|
| Eitanim | 544 | 0.125 km² | 4,352 / km² |
| Jerusalem District | 1.3 million | 652.3 km² | 2,003 / km² |
| Israel | 8.3 million | 22,078 km² | 374 / km² |
Eitanim Historical and Projected Population
Estimated Population from 100 to 2100
- JRC (European Commission's Joint Research Centre) work on the GHS built-up grid
- CIESIN (Center for International Earth Science Information Network)
- [Link] Klein Goldewijk, K., Beusen, A., Doelman, J., and Stehfest, E.: Anthropogenic land use estimates for the Holocene – HYDE 3.2, Earth Syst. Sci. Data, 9, 927–953, https://doi.org/10.5194/essd-9-927-2017, 2017.
Human Development Index (HDI)
Statistic composite index of life expectancy, education, and per capita income.
Eitanim CO2 Emissions
Carbon Dioxide (CO2) Emissions Per Capita in Tonnes Per Year
| Location | CO2 Emissions | CO2 Emissions Per Capita | CO2 Emissions Intensity |
|---|---|---|---|
| Eitanim | 5,428 tn | 9.98 tn | 43,425.7 tons/km² |
| Jerusalem District | 10,639,476 tn | 8.15 tn | 16,311.4 tons/km² |
| Israel | 81,985,471 tn | 9.92 tn | 3,713.4 tons/km² |
| 2013 CO2 emissions (tonnes/year) | 5,428 tn |
| 2013 CO2 emissions (tonnes/year) per capita | 9.98 tn |
| 2013 CO2 emissions intensity (tonnes/km²/year) | 43,425.7 tons/km² |
Natural Hazards Risk
Relative risk out of 10
| Hazard | Risk Level |
|---|---|
| Drought | High (9) |
| Earthquake | High (8) |
* Risk, particularly concerning flood or landslide, may not be for the entire area.
- Dilley, M., R.S. Chen, U. Deichmann, A.L. Lerner-Lam, M. Arnold, J. Agwe, P. Buys, O. Kjekstad, B. Lyon, and G. Yetman. 2005. Natural Disaster Hotspots: A Global Risk Analysis. Washington, D.C.: World Bank. https://doi.org/10.1596/0-8213-5930-4.
- Center for Hazards and Risk Research - CHRR - Columbia University, Center for International Earth Science Information Network - CIESIN - Columbia University, and International Research Institute for Climate and Society - IRI - Columbia University. 2005. Global Drought Hazard Frequency and Distribution. Palisades, NY: NASA Socioeconomic Data and Applications Center (SEDAC). https://doi.org/10.7927/H4VX0DFT.
- Center for Hazards and Risk Research - CHRR - Columbia University, Center for International Earth Science Information Network - CIESIN - Columbia University. 2005. Global Earthquake Hazard Distribution - Peak Ground Acceleration. Palisades, NY: NASA Socioeconomic Data and Applications Center (SEDAC). https://doi.org/10.7927/H4BZ63ZS.
Recent Nearby Earthquakes
Magnitude 3.0 and greater
| Date▼ | Time↕ | Magnitude↕ | Distance↕ | Depth↕ | Location↕ | Link |
|---|---|---|---|---|---|---|
| 7/30/15 | 2:39 AM | 4.2 | 55.8 km | 13,000 m | 24km NNE of `En Boqeq, Israel | usgs.gov |
| 12/2/07 | 7:38 AM | 4 | 44.2 km | 10,000 m | Dead Sea region | usgs.gov |
| 11/23/07 | 10:19 PM | 4.4 | 17.3 km | 11,000 m | Dead Sea region | usgs.gov |
| 11/20/07 | 11:21 PM | 3.2 | 48.1 km | 5,000 m | Dead Sea region | usgs.gov |
| 11/20/07 | 9:18 AM | 4.6 | 45 km | 10,000 m | Dead Sea region | usgs.gov |
| 2/9/07 | 10:14 PM | 4.5 | 81.9 km | 15,000 m | Dead Sea region | usgs.gov |
| 2/9/07 | 10:12 PM | 4 | 91.3 km | 2,000 m | Dead Sea region | usgs.gov |
| 11/18/06 | 2:57 AM | 3.1 | 50.8 km | 10,000 m | Dead Sea region | usgs.gov |
| 9/17/06 | 8:22 AM | 4 | 44.4 km | 1,000 m | Dead Sea region | usgs.gov |
| 9/9/06 | 4:58 AM | 4.5 | 45.9 km | 1,000 m | Dead Sea region | usgs.gov |
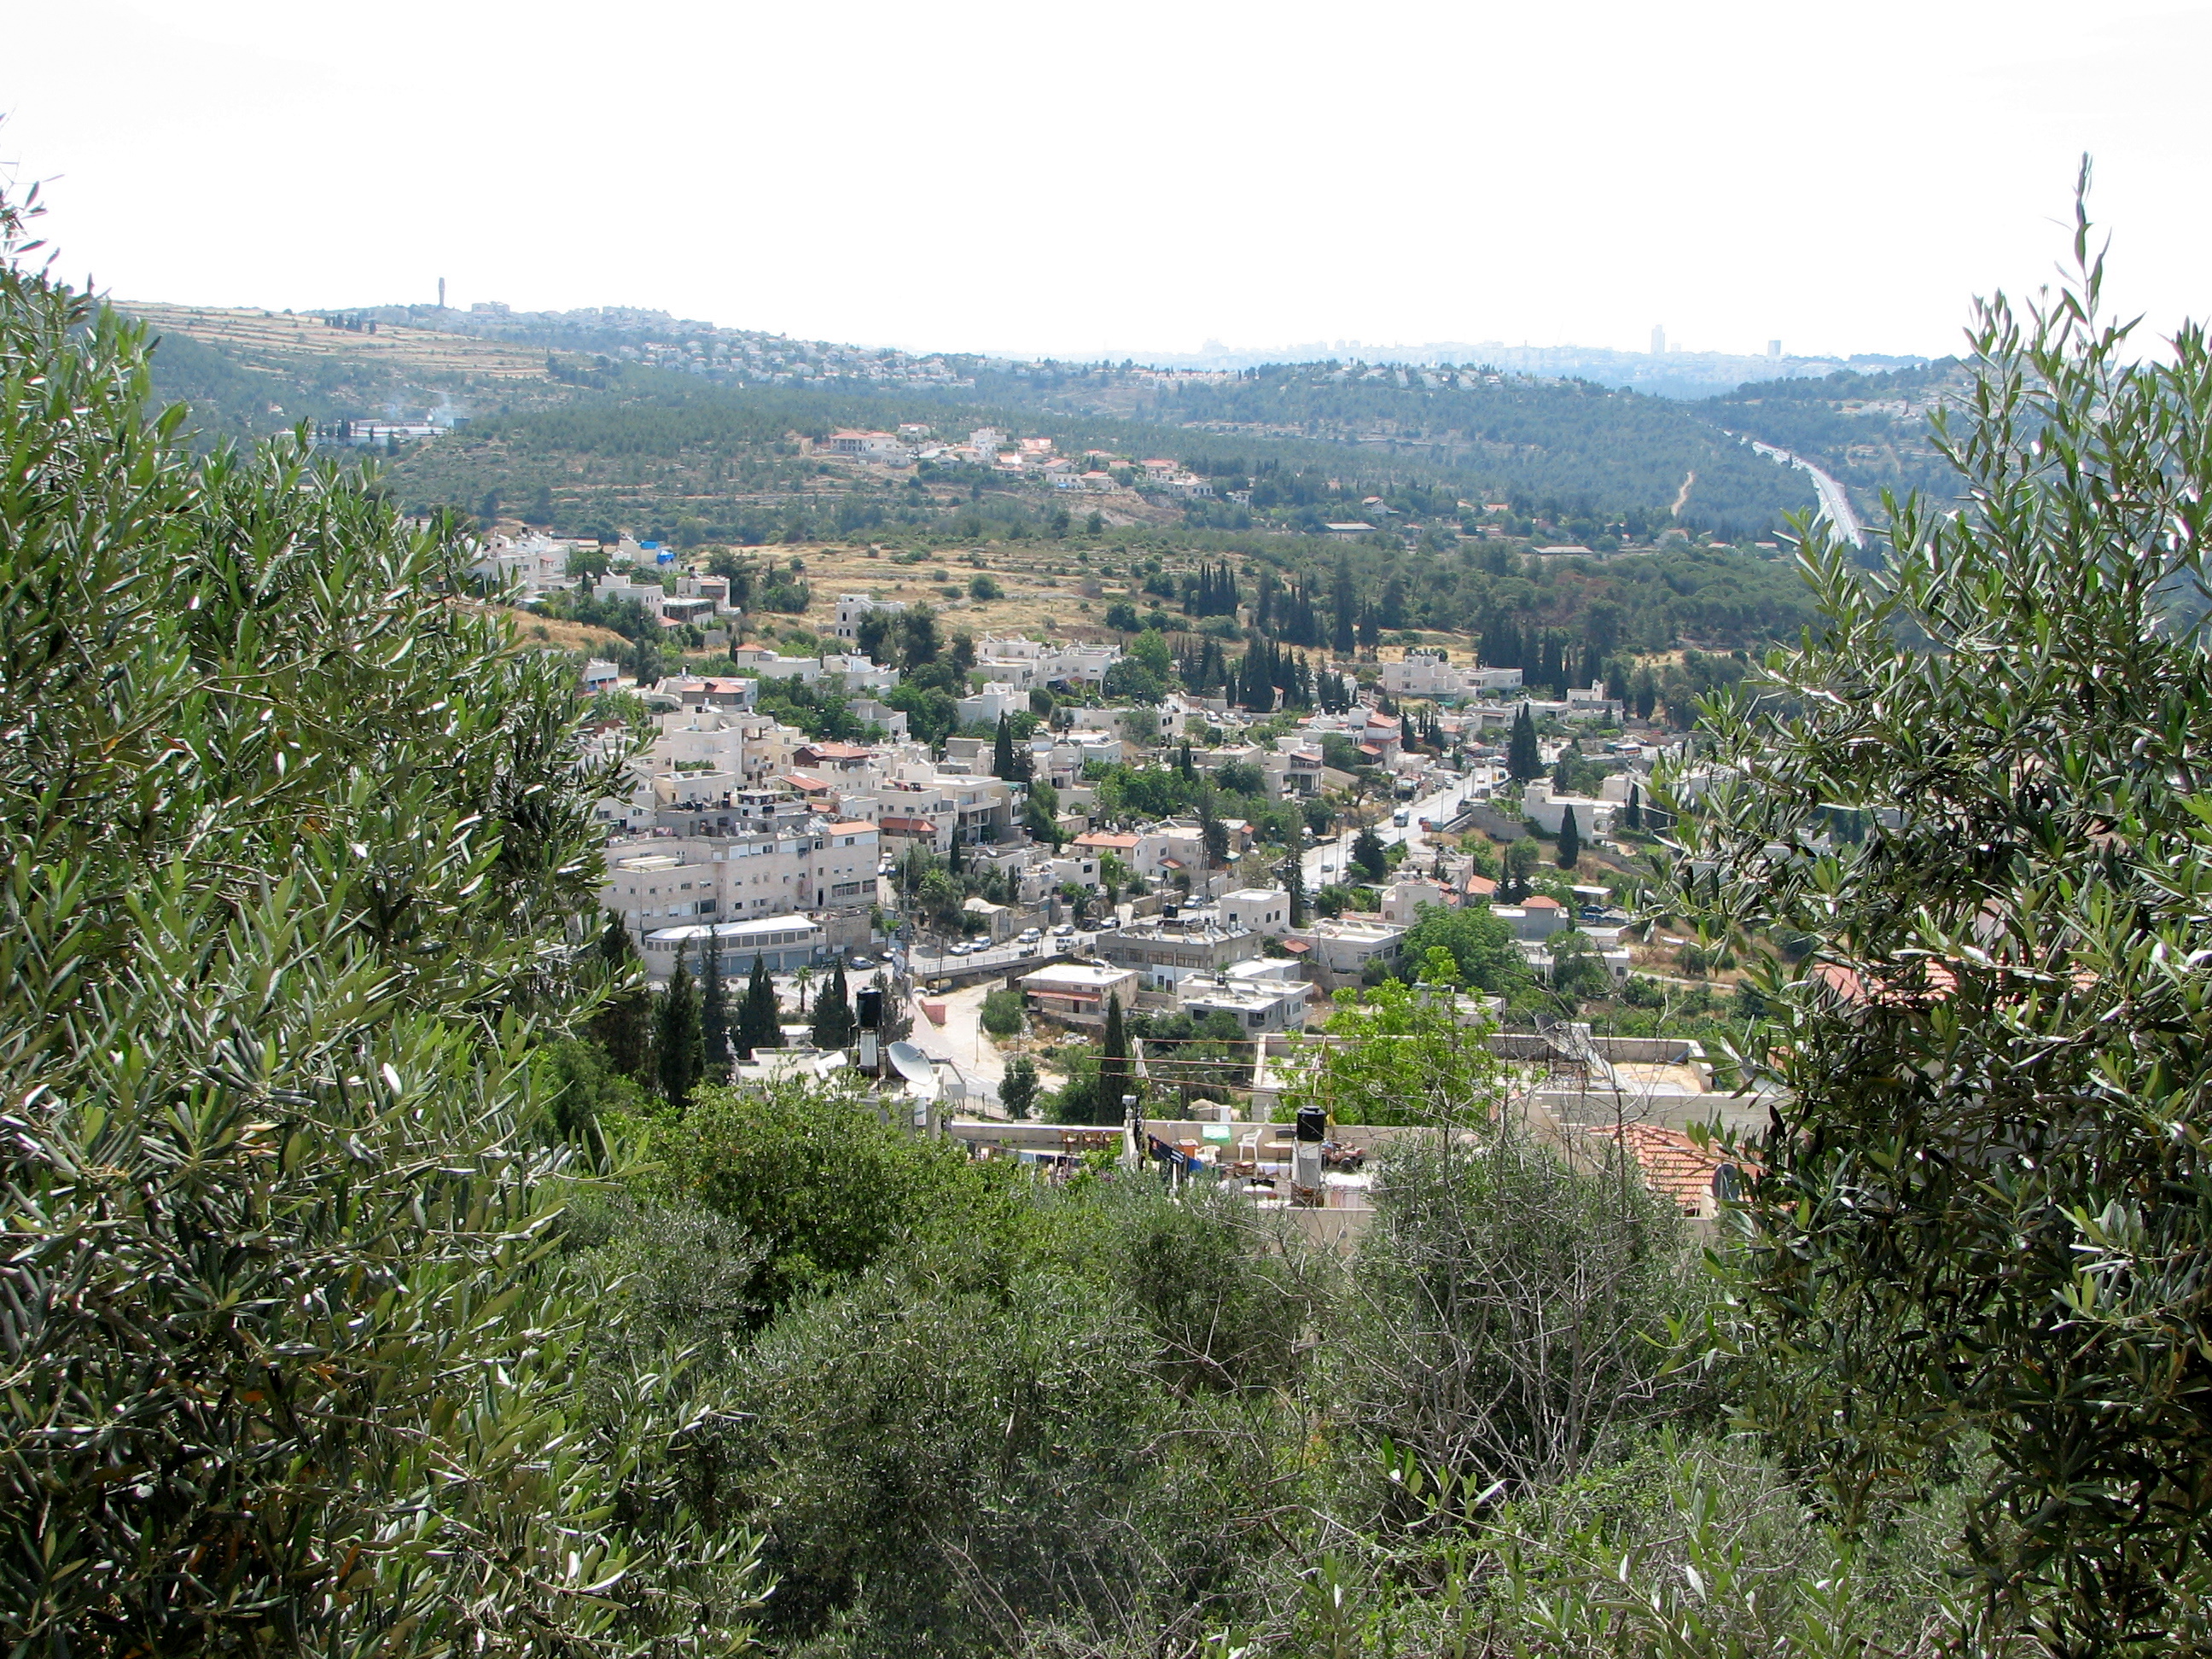
Eitanim
Eitanim (Hebrew: אֵיתָנִים, eng. Enduring) is a psychiatric hospital in central Israel. Located near Jerusalem, it falls under the jurisdiction of Mateh Yehuda Regional Council. It is named after the Bible, prophet Micha 6:2: "Listen, you enduring fo..
Eitanim Wikipedia Page


About Our Data
The data on this page is estimated using a number of publicly available tools and resources. It is provided without warranty, and could contain inaccuracies. Use at your own risk.