Categories in Aluva
Industries
Business Distribution by Industry in Aluva
| Industry Description | Number of Establishments | Average Age of Business |
|---|---|---|
| Shopping | 925 | — |
| Real estate | 601 | — |
| Apartments | 508 | — |
| Corporate management | 449 | — |
| Restaurants | 438 | — |
| Clothing stores | 393 | — |
| Travel and transportation | 316 | — |
| Education | 294 | 32 years |
| Religion | 289 | 22 years |
| Shopping other | 250 | — |
| Grocery stores and supermarkets | 249 | — |
| Electronics stores | 226 | — |
| Hardware store | 217 | — |
Aluva Facts
| Area | 29.2 km² |
| Population | 151,461 |
| Male Population | 74,665 (49.3%) |
| Female Population | 76,796 (50.7%) |
| Population change (1975 to 2020) | -8.7% |
| Population change (2000 to 2020) | -17.3% |
| Median Age | 35.1 years (Male: 34.2, Female: 35.8) |
| Neighborhoods | Periyar Nagar, Thottakkattukara, Kunnathery Thikavu, Kadungalloor, PWD Quarters, Periyar Nagar |
| Local Time | |
| Timezone | India Standard Time |
| Lat & Lng | 10.10764, 76.35158 |
| Pin Codes | 680016, 683101, 683102, 683103, 683108, More |
Map of Aluva
Interactive Map
Aluva Population
Years 1975 to 2020
| Data | 1975 | 1990 | 2000 | 2015 | 2020 |
|---|---|---|---|---|---|
| Population | 165,924 | 198,921 | 183,162 | 143,987 | 151,461 |
| Population Density | 5,684.8 / km² | 6,815.3 / km² | 6,275.4 / km² | 4,933.2 / km² | 5,189.2 / km² |
Aluva Population change from 2000 to 2015
Decrease of 21.4% from year 2000 to 2015
| Location | Change since 1975 | Change since 1990 | Change since 2000 |
|---|---|---|---|
| Aluva | -13.2% | -27.6% | -21.4% |
| Kerala | +36.8% | +14% | +4.9% |
| India | +111.1% | +50.6% | +24.5% |
Aluva Median Age
Median Age: 35.1 years
| Location | Median Age | Median Age (Female) | Median Age (Male) |
|---|---|---|---|
| Aluva | 35.1 yrs | 35.8 yrs | 34.2 yrs |
| Kerala | 32 yrs | 33 yrs | 30.9 yrs |
| India | 24.9 yrs | 25.4 yrs | 24.5 yrs |
Aluva Population Density
Population Density: 5,189 / km²
| Location | Population | Area | Density |
|---|---|---|---|
| Aluva | 151,461 | 29.2 km² | 5,189 / km² |
| Kerala | 33.8 million | 38,821.4 km² | 872 / km² |
| India | 1,307 million | 3,083,563.4 km² | 424 / km² |
Aluva Historical and Projected Population
Estimated Population from 0 to 2100
- JRC (European Commission's Joint Research Centre) work on the GHS built-up grid
- CIESIN (Center for International Earth Science Information Network)
- [Link] Klein Goldewijk, K., Beusen, A., Doelman, J., and Stehfest, E.: Anthropogenic land use estimates for the Holocene – HYDE 3.2, Earth Syst. Sci. Data, 9, 927–953, https://doi.org/10.5194/essd-9-927-2017, 2017.
Neighborhoods in Aluva
Percentage of businesses by neighborhood in Aluva
Pin Codes
Percentage of businesses by Postal Codes in Aluva
Price Distribution
Business distribution by price for Aluva
Human Development Index (HDI)
Statistic composite index of life expectancy, education, and per capita income.
Aluva CO2 Emissions
Carbon Dioxide (CO2) Emissions Per Capita in Tonnes Per Year
| Location | CO2 Emissions | CO2 Emissions Per Capita | CO2 Emissions Intensity |
|---|---|---|---|
| Aluva | 319,126 tn | 2.11 tn | 10,933.6 tons/km² |
| Kerala | 62,962,414 tn | 1.86 tn | 1,621.8 tons/km² |
| India | 1,928,568,344 tn | 1.48 tn | 625.4 tons/km² |
| 2013 CO2 emissions (tonnes/year) | 319,126 tn |
| 2013 CO2 emissions (tonnes/year) per capita | 2.11 tn |
| 2013 CO2 emissions intensity (tonnes/km²/year) | 10,933.6 tons/km² |
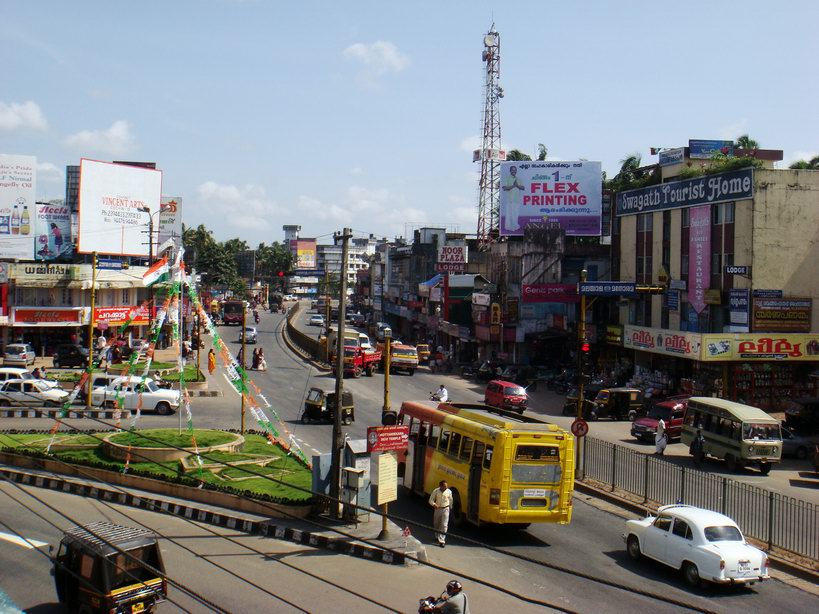
Aluva
Aluva (formerly Alwaye), is second biggest town of Greater Cochin City in the Ernakulam district of Kerala, India which is also considered as the Industrial and Commercial City of Kochi. Located on the River Periyar, Aluva is the industrial epicenter..
Aluva Wikipedia Page


About Our Data
The data on this page is estimated using a number of publicly available tools and resources. It is provided without warranty, and could contain inaccuracies. Use at your own risk.