Categories in Chomu
Auto Parts StoreBattery StoreBattery WholesalerCar Accessories StoreCar Battery StoreCar repairCar Repair and MaintenanceCar WashElectric Motor Repair ShopElectric Motor StoreGas StationHonda DealerMechanicMotorcycle DealerMotorcycle Parts StoreMotorcycle repairMotorcycle ShopNew car dealersOil Change ServiceTire ShopWheel Alignment ServiceAgricultural CooperativeAgricultural Machinery ManufacturerAgricultural ProductionAgricultural wholesaleBuilding Materials SupplierCement SupplierConstruction Material WholesalerDairy FarmDiesel Fuel SupplierElectrical Appliance WholesalerElectrical Equipment SupplierElectronics WholesalerFarm Equipment SupplierFarmingFertilizer SupplierFlour MillFood ManufacturerFood Products SupplierFuel supplierFurniture MakerFurniture ManufacturerGarment ExporterHandicraftIron and Steel StoreJewelry ManufacturerMarble SupplierPharmaceutical CompanyPharmaceutical Products WholesalerPipe Manufacturer
Showing 1-50 of 328
…
Industries
Business Distribution by Industry in Chomu
| Industry Description | Number of Establishments |
|---|---|
| Shopping | 615 |
| Education | 229 |
| Clothing stores | 207 |
| Shopping other | 207 |
| Electronics stores | 194 |
| Grocery stores and supermarkets | 136 |
| Restaurants | 130 |
| Hospitals | 128 |
| Hardware store | 105 |
| Travel and transportation | 97 |
Chomu Facts
| Area | 11.9 km² |
| Population | 202,288 |
| Male Population | 105,324 (52.1%) |
| Female Population | 96,964 (47.9%) |
| Population change (1975 to 2020) | +90.4% |
| Population change (2000 to 2020) | +22.0% |
| Median Age | 23.4 years (Male: 23, Female: 23.9) |
| Local Time | |
| Timezone | India Standard Time |
| Lat & Lng | 27.16955, 75.72226 |
Map of Chomu
Interactive Map
Chomu Population
Years 1975 to 2020
| Data | 1975 | 1990 | 2000 | 2015 | 2020 |
|---|---|---|---|---|---|
| Population | 106,233 | 143,500 | 165,838 | 190,589 | 202,288 |
| Population Density | 8,899.1 / km² | 12,020.9 / km² | 13,892.2 / km² | 15,965.6 / km² | 16,945.6 / km² |
Sources: JRC (European Commission's Joint Research Centre) work on the GHS built-up grid
Chomu Population change from 2000 to 2015
Increase of 14.9% from year 2000 to 2015
| Location | Change since 1975 | Change since 1990 | Change since 2000 |
|---|---|---|---|
| Chomu | +79.4% | +32.8% | +14.9% |
| Rajasthan | +141.7% | +63.1% | +30.2% |
| India | +111.1% | +50.6% | +24.5% |
Sources: JRC (European Commission's Joint Research Centre) work on the GHS built-up grid
Chomu Median Age
Median Age: 23.4 years
| Location | Median Age | Median Age (Female) | Median Age (Male) |
|---|---|---|---|
| Chomu | 23.4 yrs | 23.9 yrs | 23 yrs |
| Rajasthan | 22.4 yrs | 23 yrs | 21.9 yrs |
| India | 24.9 yrs | 25.4 yrs | 24.5 yrs |
Sources: CIESIN (Center for International Earth Science Information Network)
Chomu Population Density
Population Density: 16,946 / km²
| Location | Population | Area | Density |
|---|---|---|---|
| Chomu | 202,288 | 11.9 km² | 16,946 / km² |
| Rajasthan | 75.3 million | 342,463 km² | 220 / km² |
| India | 1,307 million | 3,083,563.4 km² | 424 / km² |
Sources: JRC (European Commission's Joint Research Centre) work on the GHS built-up grid
Chomu Historical and Projected Population
Estimated Population from 1710 to 2100
Sources:
- JRC (European Commission's Joint Research Centre) work on the GHS built-up grid
- CIESIN (Center for International Earth Science Information Network)
- [Link] Klein Goldewijk, K., Beusen, A., Doelman, J., and Stehfest, E.: Anthropogenic land use estimates for the Holocene – HYDE 3.2, Earth Syst. Sci. Data, 9, 927–953, https://doi.org/10.5194/essd-9-927-2017, 2017.
Human Development Index (HDI)
Statistic composite index of life expectancy, education, and per capita income.
Source: [Link] Kummu, M., Taka, M. &Guillaume, J. Gridded global datasets for Gross Domestic Product and Human Development Index over 1990–2015. Sci Data 5, 180004 (2018) doi:10.1038/sdata.2018.4
Chomu CO2 Emissions
Carbon Dioxide (CO2) Emissions Per Capita in Tonnes Per Year
| Location | CO2 Emissions | CO2 Emissions Per Capita | CO2 Emissions Intensity |
|---|---|---|---|
| Chomu | 389,105 tn | 1.92 tn | 32,595.2 tons/km² |
| Rajasthan | 105,422,055 tn | 1.4 tn | 307.8 tons/km² |
| India | 1,928,568,344 tn | 1.48 tn | 625.4 tons/km² |
Sources: [Link] Moran, D., Kanemoto K; Jiborn, M., Wood, R., Többen, J., and Seto, K.C. (2018) Carbon footprints of 13,000 cities. Environmental Research Letters DOI: 10.1088/1748-9326/aac72a
Chomu CO2 Emissions
| 2013 CO2 emissions (tonnes/year) | 389,105 tn |
| 2013 CO2 emissions (tonnes/year) per capita | 1.92 tn |
| 2013 CO2 emissions intensity (tonnes/km²/year) | 32,595.2 tons/km² |
Natural Hazards Risk
Relative risk out of 10
| Hazard | Risk Level |
|---|---|
| Drought | High (10) |
| Earthquake | Low (2) |
* Risk, particularly concerning flood or landslide, may not be for the entire area.
Sources:
- Dilley, M., R.S. Chen, U. Deichmann, A.L. Lerner-Lam, M. Arnold, J. Agwe, P. Buys, O. Kjekstad, B. Lyon, and G. Yetman. 2005. Natural Disaster Hotspots: A Global Risk Analysis. Washington, D.C.: World Bank. https://doi.org/10.1596/0-8213-5930-4.
- Center for Hazards and Risk Research - CHRR - Columbia University, Center for International Earth Science Information Network - CIESIN - Columbia University, and International Research Institute for Climate and Society - IRI - Columbia University. 2005. Global Drought Hazard Frequency and Distribution. Palisades, NY: NASA Socioeconomic Data and Applications Center (SEDAC). https://doi.org/10.7927/H4VX0DFT.
- Center for Hazards and Risk Research - CHRR - Columbia University, Center for International Earth Science Information Network - CIESIN - Columbia University. 2005. Global Earthquake Hazard Distribution - Peak Ground Acceleration. Palisades, NY: NASA Socioeconomic Data and Applications Center (SEDAC). https://doi.org/10.7927/H4BZ63ZS.
Recent Nearby Earthquakes
Magnitude 3.0 and greater
| Date▼ | Time↕ | Magnitude↕ | Distance↕ | Depth↕ | Location↕ | Link |
|---|---|---|---|---|---|---|
| 7/8/18 | 4:13 AM | 3.6 | 83.4 km | 10,000 m | 7km N of Kot Putli, India | usgs.gov |
| 9/3/15 | 5:57 PM | 4 | 32.2 km | 14,200 m | 7km WNW of Ringas, India | usgs.gov |
| 2/24/13 | 12:57 AM | 3.6 | 25.2 km | 10,000 m | 12km SW of Ringas, India | usgs.gov |
| 12/20/12 | 1:00 PM | 3.9 | 66 km | 10,000 m | Rajasthan, India | usgs.gov |
| 12/24/06 | 10:43 PM | 4.2 | 53.5 km | 10,000 m | Rajasthan, India | usgs.gov |
| 8/10/03 | 11:17 AM | 4.5 | 5.4 km | 10,000 m | Rajasthan, India | usgs.gov |
| 5/2/02 | 2:29 PM | 4.1 | 59 km | 33,000 m | Rajasthan, India | usgs.gov |
Source: U.S. Geological Survey (USGS)
Chomu
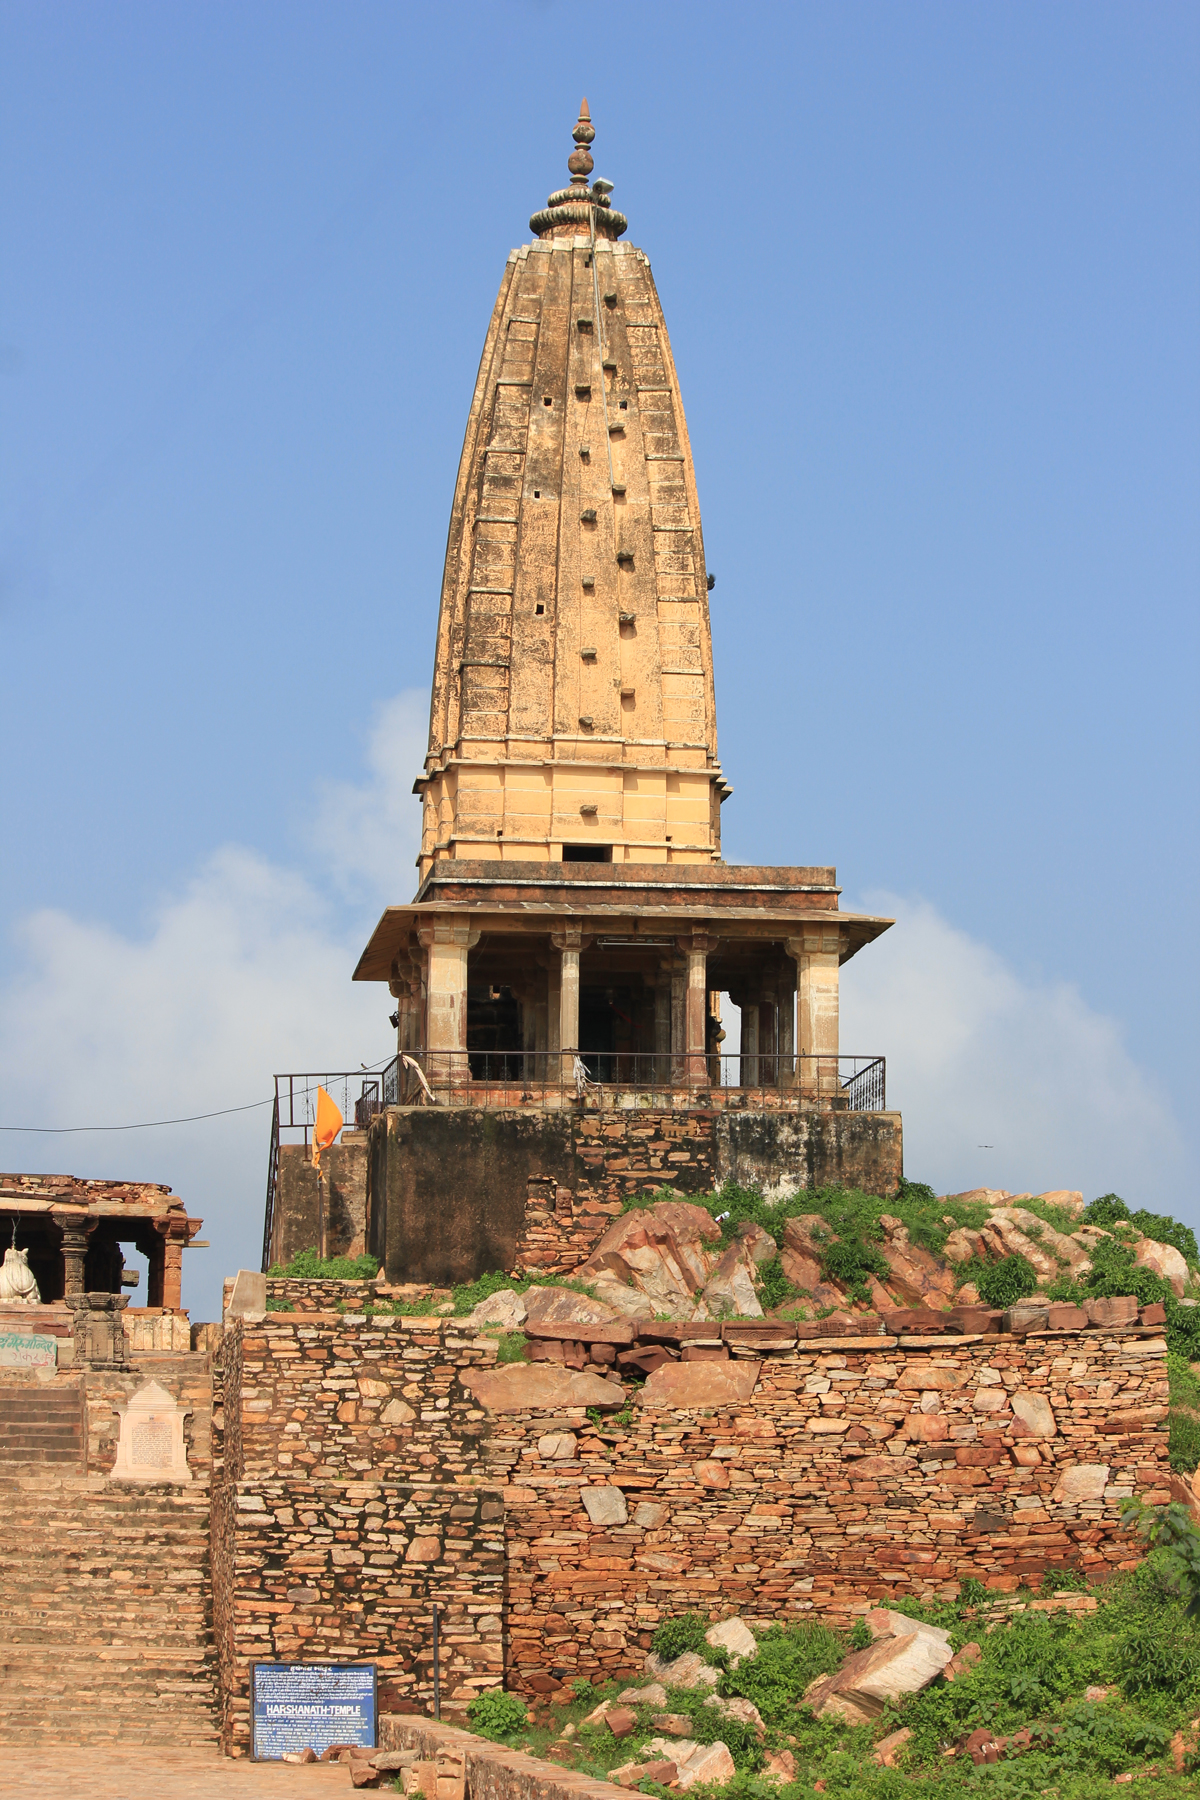
Chomu is a city and a municipality in Jaipur district in the state of Rajasthan, India.
Chomu Wikipedia Page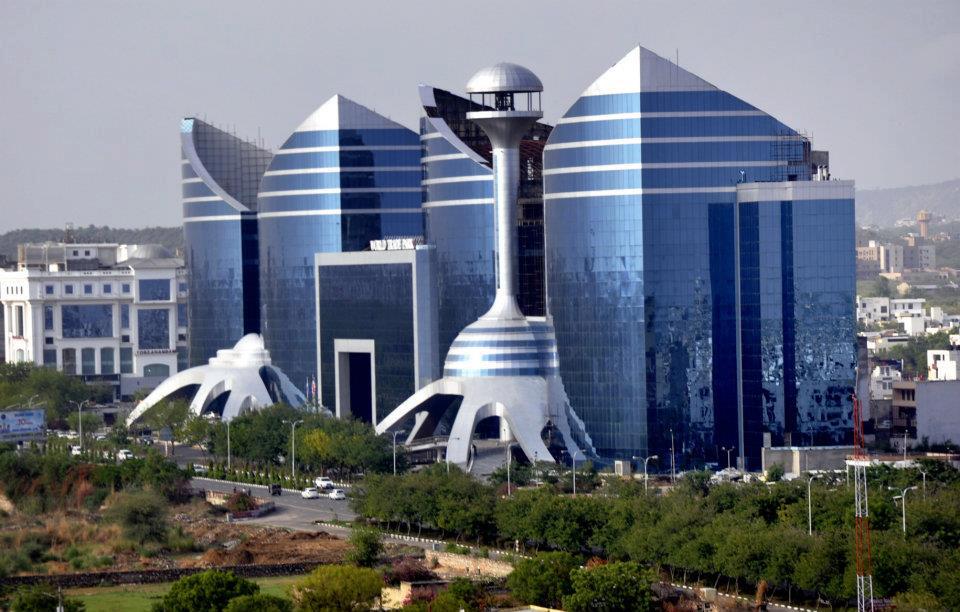

About Our Data
The data on this page is estimated using a number of publicly available tools and resources. It is provided without warranty, and could contain inaccuracies. Use at your own risk.