Categories in Dediapada
Industries
Business Distribution by Industry in Dediapada
| Industry Description | Number of Establishments |
|---|---|
| Shopping | 86 |
| Education | 45 |
| Shopping other | 40 |
| Restaurants | 39 |
| Clothing stores | 28 |
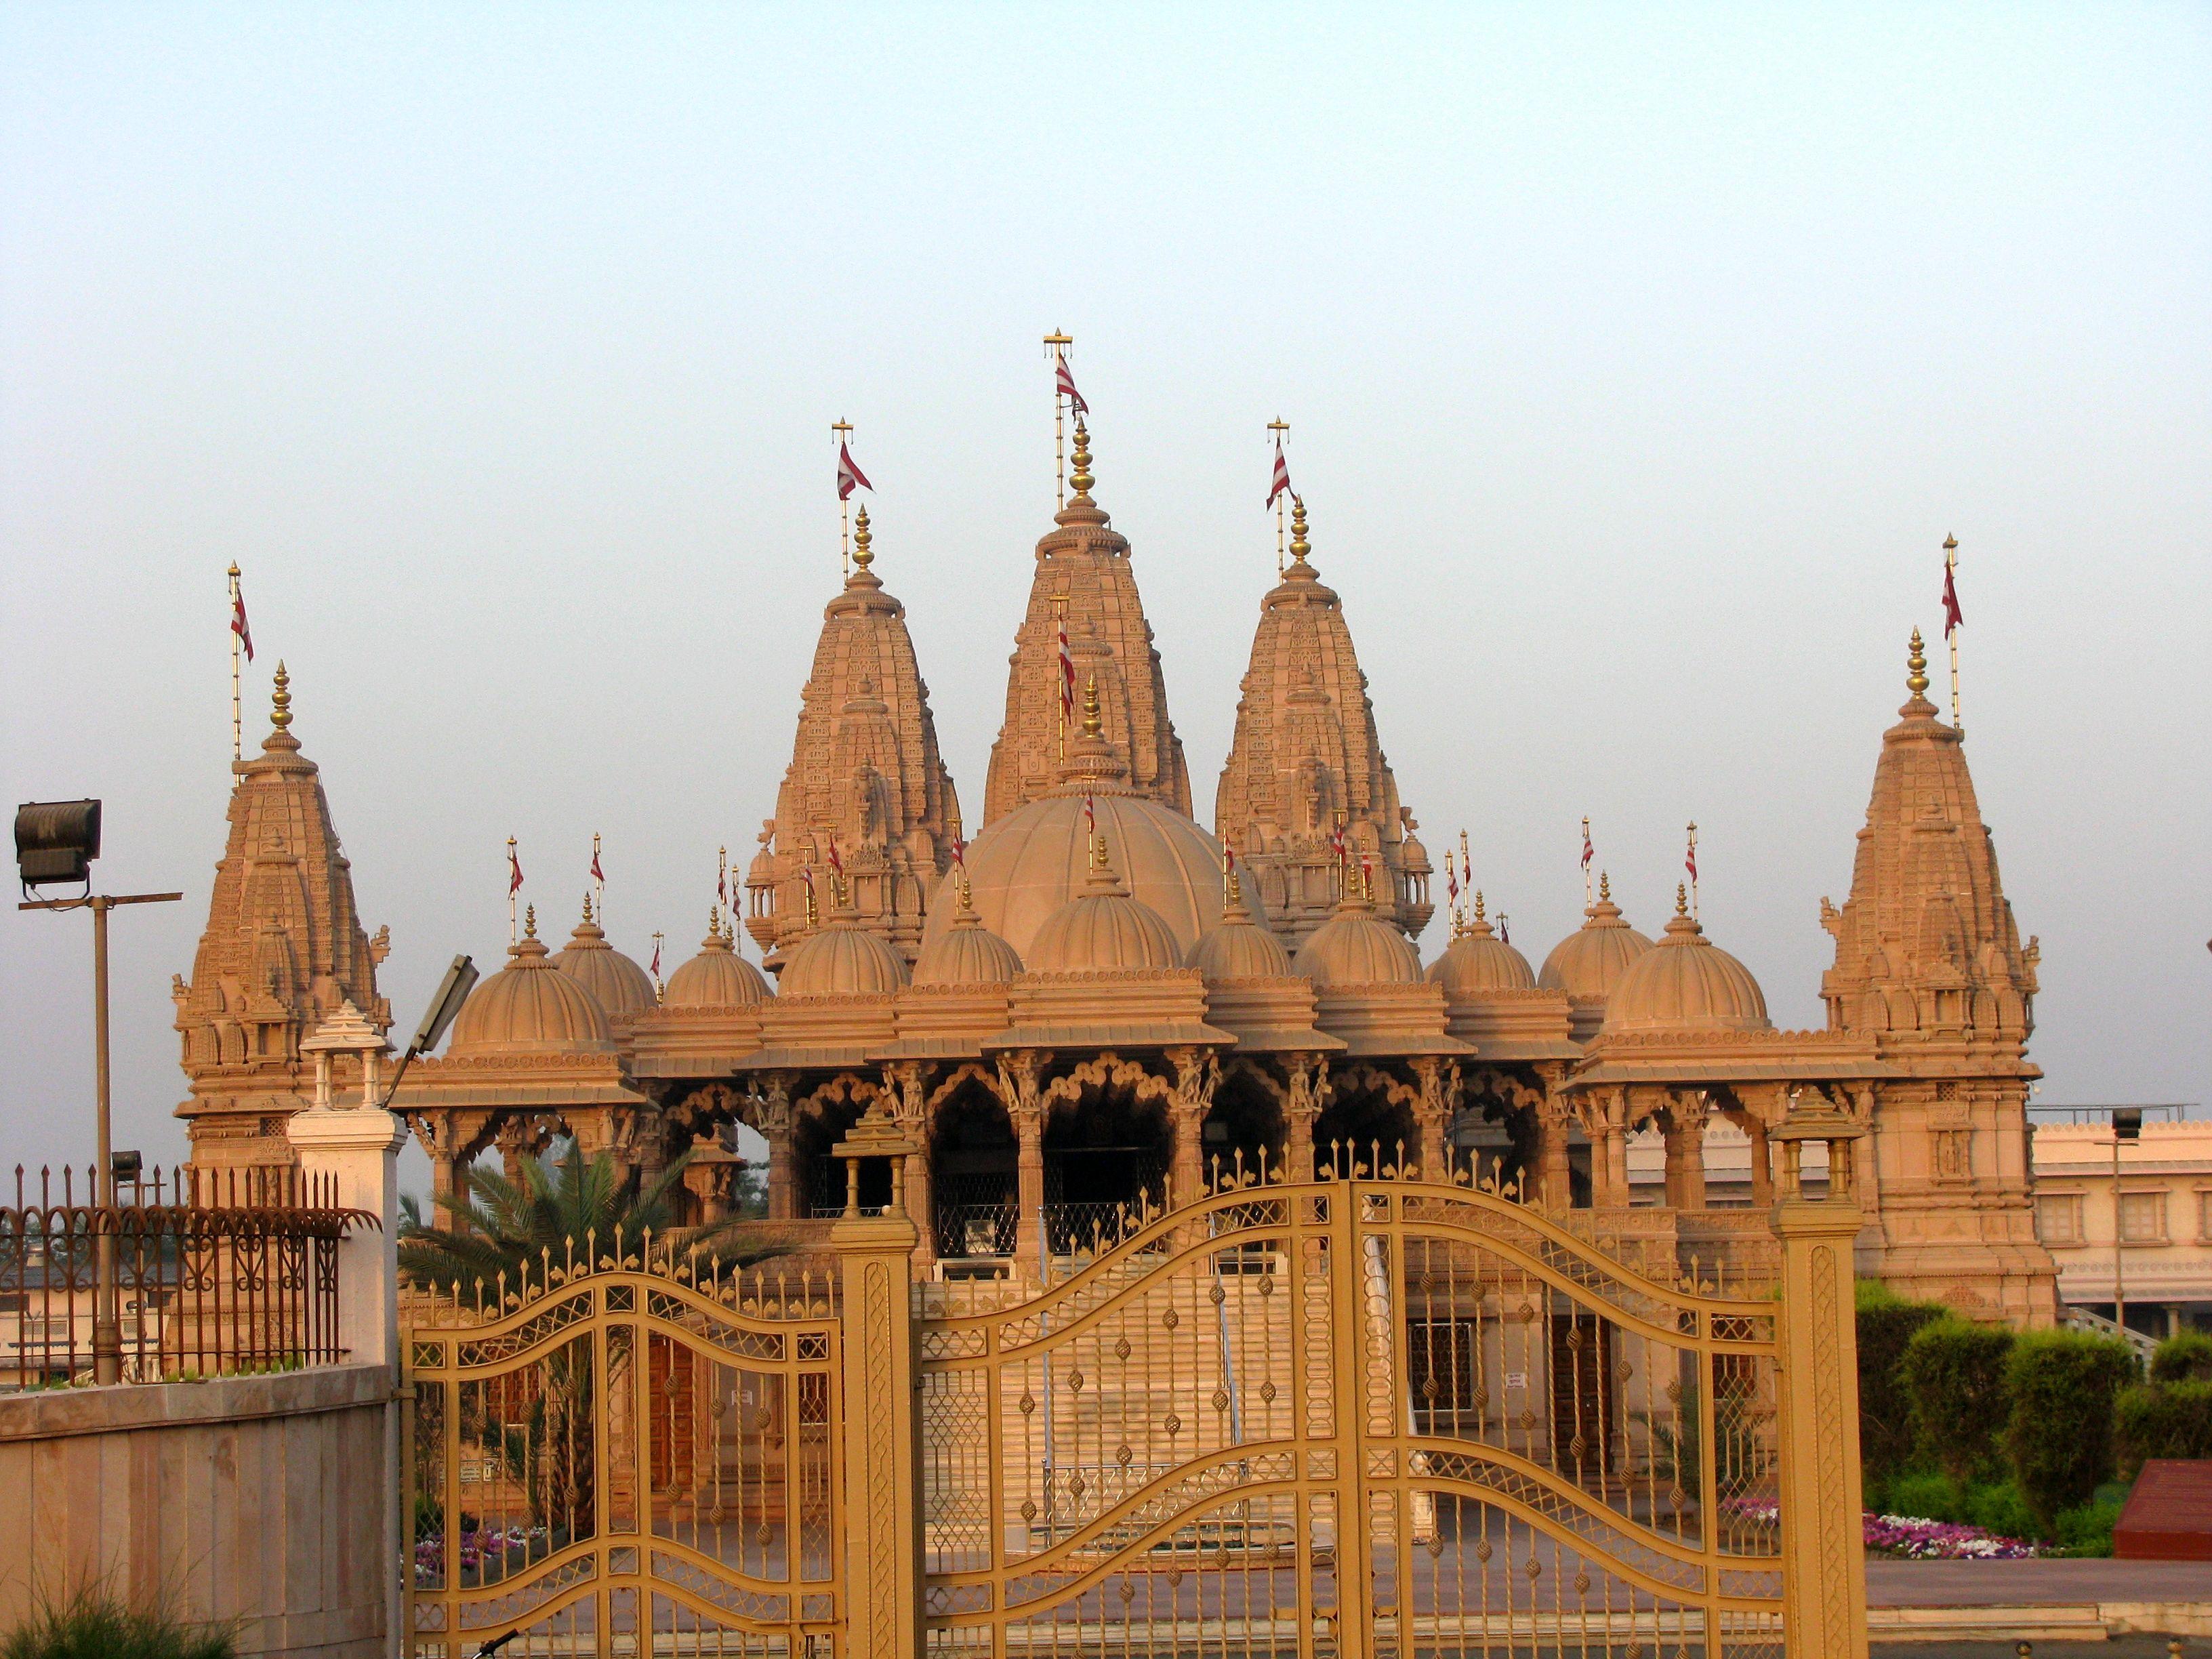
| Hindu temple | 28 |
| Post office | 23 |
| Electronics stores | 23 |
| Grocery stores and supermarkets | 20 |
| Primary and elementary schools | 17 |
Dediapada Facts
| Area | 903.3 km² |
| Population | 162,412 |
| Male Population | 82,228 (50.6%) |
| Female Population | 80,184 (49.4%) |
| Population change (1975 to 2020) | +80.1% |
| Population change (2000 to 2020) | +3.7% |
| Median Age | 25.2 years (Male: 24.8, Female: 25.7) |
| Area Codes | 2649 |
| Local Time | |
| Timezone | India Standard Time |
| Lat & Lng | 21.62769, 73.59026 |
| Pin Codes | 393040, 393041 |
Map of Dediapada
Interactive Map
Dediapada Population
Years 1975 to 2020
| Data | 1975 | 1990 | 2000 | 2015 | 2020 |
|---|---|---|---|---|---|
| Population | 90,185 | 131,807 | 156,657 | 153,351 | 162,412 |
| Population Density | 99.8 / km² | 145.9 / km² | 173.4 / km² | 169.8 / km² | 179.8 / km² |
Dediapada Population change from 2000 to 2015
Decrease of 2.1% from year 2000 to 2015
| Location | Change since 1975 | Change since 1990 | Change since 2000 |
|---|---|---|---|
| Dediapada | +70% | +16.3% | -2.1% |
| Gujarat | +124.2% | +56.1% | +27.3% |
| India | +111.1% | +50.6% | +24.5% |
Dediapada Median Age
Median Age: 25.2 years
| Location | Median Age | Median Age (Female) | Median Age (Male) |
|---|---|---|---|
| Dediapada | 25.2 yrs | 25.7 yrs | 24.8 yrs |
| Gujarat | 25.9 yrs | 26.6 yrs | 25.4 yrs |
| India | 24.9 yrs | 25.4 yrs | 24.5 yrs |
Dediapada Population Density
Population Density: 180 / km²
| Location | Population | Area | Density |
|---|---|---|---|
| Dediapada | 162,412 | 903.3 km² | 180 / km² |
| Gujarat | 65.6 million | 185,787.8 km² | 353 / km² |
| India | 1,307 million | 3,083,563.4 km² | 424 / km² |
Dediapada Historical and Projected Population
Estimated Population from 0 to 2100
- JRC (European Commission's Joint Research Centre) work on the GHS built-up grid
- CIESIN (Center for International Earth Science Information Network)
- [Link] Klein Goldewijk, K., Beusen, A., Doelman, J., and Stehfest, E.: Anthropogenic land use estimates for the Holocene – HYDE 3.2, Earth Syst. Sci. Data, 9, 927–953, https://doi.org/10.5194/essd-9-927-2017, 2017.
Human Development Index (HDI)
Statistic composite index of life expectancy, education, and per capita income.
Dediapada CO2 Emissions
Carbon Dioxide (CO2) Emissions Per Capita in Tonnes Per Year
| Location | CO2 Emissions | CO2 Emissions Per Capita | CO2 Emissions Intensity |
|---|---|---|---|
| Dediapada | 268,697 tn | 1.65 tn | 297.5 tons/km² |
| Gujarat | 117,116,364 tn | 1.78 tn | 630.4 tons/km² |
| India | 1,928,568,344 tn | 1.48 tn | 625.4 tons/km² |
| 2013 CO2 emissions (tonnes/year) | 268,697 tn |
| 2013 CO2 emissions (tonnes/year) per capita | 1.65 tn |
| 2013 CO2 emissions intensity (tonnes/km²/year) | 297.5 tons/km² |
Natural Hazards Risk
Relative risk out of 10
| Hazard | Risk Level |
|---|---|
| Drought | Medium (7) |
| Flood | Medium (7) |
* Risk, particularly concerning flood or landslide, may not be for the entire area.
- Dilley, M., R.S. Chen, U. Deichmann, A.L. Lerner-Lam, M. Arnold, J. Agwe, P. Buys, O. Kjekstad, B. Lyon, and G. Yetman. 2005. Natural Disaster Hotspots: A Global Risk Analysis. Washington, D.C.: World Bank. https://doi.org/10.1596/0-8213-5930-4.
- Center for Hazards and Risk Research - CHRR - Columbia University, Center for International Earth Science Information Network - CIESIN - Columbia University, and International Research Institute for Climate and Society - IRI - Columbia University. 2005. Global Drought Hazard Frequency and Distribution. Palisades, NY: NASA Socioeconomic Data and Applications Center (SEDAC). https://doi.org/10.7927/H4VX0DFT.
- Center for Hazards and Risk Research - CHRR - Columbia University, Center for International Earth Science Information Network - CIESIN - Columbia University. 2005. Global Flood Hazard Frequency and Distribution. Palisades, NY: NASA Socioeconomic Data and Applications Center (SEDAC). https://doi.org/10.7927/H4668B3D.
Recent Nearby Earthquakes
Magnitude 3.0 and greater
| Date▼ | Time↕ | Magnitude↕ | Distance↕ | Depth↕ | Location↕ | Link |
|---|---|---|---|---|---|---|
| 11/17/96 | 6:12 PM | 4.2 | 59.4 km | 10,000 m | Gujarat, India | usgs.gov |
Dediapada
Dediapada is a small village in Narmada District with a sizable population of Adivasi communities in which Vasava and Tadvi form the majority. Despite being remote in location, it is well connected by Gujarat and Maharashtra ST Buses.
Dediapada Wikipedia Page

About Our Data
The data on this page is estimated using a number of publicly available tools and resources. It is provided without warranty, and could contain inaccuracies. Use at your own risk.