Categories in Gulmarg
Industries
Business Distribution by Industry in Gulmarg
| Industry Description | Number of Establishments |
|---|---|
| Other accommodation | 42 |
| Travel agencies | 39 |
| Hotels and motels | 37 |
| Restaurants | 23 |
| Tour operators | 12 |
| Mosques | 11 |
| Sporting goods | 11 |
| Education | 10 |
| Shopping | 10 |
| Religion | 9 |
| Cafes | 9 |
| Travel and transportation | 9 |
Gulmarg Facts
| Area | 14.3 km² |
| Population | 1,747 |
| Male Population | 936 (53.6%) |
| Female Population | 811 (46.4%) |
| Population change (1975 to 2020) | +1223.5% |
| Population change (2000 to 2020) | +130.5% |
| Median Age | 22.6 years (Male: 23, Female: 22.1) |
| Neighborhoods | Babareshi |
| Local Time | |
| Timezone | India Standard Time |
| Lat & Lng | 34.05363, 74.38188 |
| Pin Codes | 193403 |
Map of Gulmarg
Interactive Map
Gulmarg Population
Years 1975 to 2020
| Data | 1975 | 1990 | 2000 | 2015 | 2020 |
|---|---|---|---|---|---|
| Population | 132 | 303 | 758 | 1,648 | 1,747 |
| Population Density | 9.3 / km² | 21.3 / km² | 53.2 / km² | 115.6 / km² | 122.6 / km² |
Gulmarg Population change from 2000 to 2015
Increase of 117.4% from year 2000 to 2015
| Location | Change since 1975 | Change since 1990 | Change since 2000 |
|---|---|---|---|
| Gulmarg | +1148.5% | +443.9% | +117.4% |
| Jammu and Kashmir | +159.9% | +71.3% | +34.1% |
| India | +111.1% | +50.6% | +24.5% |
Gulmarg Median Age
Median Age: 22.6 years
| Location | Median Age | Median Age (Female) | Median Age (Male) |
|---|---|---|---|
| Gulmarg | 22.6 yrs | 22.1 yrs | 23 yrs |
| Jammu and Kashmir | 23.4 yrs | 23.3 yrs | 23.5 yrs |
| India | 24.9 yrs | 25.4 yrs | 24.5 yrs |
Gulmarg Population Density
Population Density: 123 / km²
| Location | Population | Area | Density |
|---|---|---|---|
| Gulmarg | 1,747 | 14.3 km² | 123 / km² |
| Jammu and Kashmir | 13.7 million | 105,261.9 km² | 130 / km² |
| India | 1,307 million | 3,083,563.4 km² | 424 / km² |
Gulmarg Historical and Projected Population
Estimated Population from 1740 to 2100
- JRC (European Commission's Joint Research Centre) work on the GHS built-up grid
- CIESIN (Center for International Earth Science Information Network)
- [Link] Klein Goldewijk, K., Beusen, A., Doelman, J., and Stehfest, E.: Anthropogenic land use estimates for the Holocene – HYDE 3.2, Earth Syst. Sci. Data, 9, 927–953, https://doi.org/10.5194/essd-9-927-2017, 2017.
Area Codes
Percentage Area Codes used by businesses in Gulmarg
Pin Codes
Percentage of businesses by Postal Codes in Gulmarg
Price Distribution
Business distribution by price for Gulmarg
Human Development Index (HDI)
Statistic composite index of life expectancy, education, and per capita income.
Gulmarg CO2 Emissions
Carbon Dioxide (CO2) Emissions Per Capita in Tonnes Per Year
| Location | CO2 Emissions | CO2 Emissions Per Capita | CO2 Emissions Intensity |
|---|---|---|---|
| Gulmarg | 2,491 tn | 1.43 tn | 174.8 tons/km² |
| Jammu and Kashmir | 18,484,229 tn | 1.35 tn | 175.6 tons/km² |
| India | 1,928,568,344 tn | 1.48 tn | 625.4 tons/km² |
| 2013 CO2 emissions (tonnes/year) | 2,491 tn |
| 2013 CO2 emissions (tonnes/year) per capita | 1.43 tn |
| 2013 CO2 emissions intensity (tonnes/km²/year) | 174.8 tons/km² |
Natural Hazards Risk
Relative risk out of 10
| Hazard | Risk Level |
|---|---|
| Flood | High (9) |
| Earthquake | Medium (7) |
* Risk, particularly concerning flood or landslide, may not be for the entire area.
- Dilley, M., R.S. Chen, U. Deichmann, A.L. Lerner-Lam, M. Arnold, J. Agwe, P. Buys, O. Kjekstad, B. Lyon, and G. Yetman. 2005. Natural Disaster Hotspots: A Global Risk Analysis. Washington, D.C.: World Bank. https://doi.org/10.1596/0-8213-5930-4.
- Center for Hazards and Risk Research - CHRR - Columbia University, Center for International Earth Science Information Network - CIESIN - Columbia University. 2005. Global Flood Hazard Frequency and Distribution. Palisades, NY: NASA Socioeconomic Data and Applications Center (SEDAC). https://doi.org/10.7927/H4668B3D.
- Center for Hazards and Risk Research - CHRR - Columbia University, Center for International Earth Science Information Network - CIESIN - Columbia University. 2005. Global Earthquake Hazard Distribution - Peak Ground Acceleration. Palisades, NY: NASA Socioeconomic Data and Applications Center (SEDAC). https://doi.org/10.7927/H4BZ63ZS.
Recent Nearby Earthquakes
Magnitude 3.0 and greater
| Date▼ | Time↕ | Magnitude↕ | Distance↕ | Depth↕ | Location↕ | Link |
|---|---|---|---|---|---|---|
| 7/21/18 | 7:37 PM | 4.2 | 49.3 km | 43,840 m | 24km SSE of Athmuqam, Pakistan | usgs.gov |
| 7/21/18 | 9:19 AM | 4.5 | 38.4 km | 40,060 m | 23km N of Uri, India | usgs.gov |
| 12/25/17 | 11:51 PM | 4.2 | 54.2 km | 10,000 m | 25km NW of Uri, India | usgs.gov |
| 9/23/17 | 12:14 AM | 4.6 | 26.4 km | 35,000 m | 4km WSW of Sumbal, India | usgs.gov |
| 12/17/16 | 5:25 PM | 4.5 | 53.2 km | 36,070 m | 8km NNE of Bagh, Pakistan | usgs.gov |
| 7/9/15 | 3:30 AM | 4.2 | 75.2 km | 63,070 m | 23km NE of Athmuqam, Pakistan | usgs.gov |
| 5/18/15 | 4:46 PM | 4.3 | 60.5 km | 32,320 m | 21km N of Bagh, Pakistan | usgs.gov |
| 9/22/14 | 8:49 PM | 4.7 | 50.3 km | 26,730 m | 25km NNW of Uri, India | usgs.gov |
| 10/11/12 | 11:54 PM | 4.6 | 63.4 km | 26,000 m | Pakistan | usgs.gov |
| 1/4/12 | 4:31 PM | 4.2 | 67.1 km | 22,800 m | southwestern Kashmir | usgs.gov |
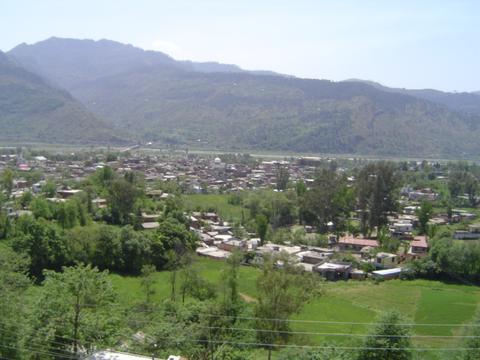
Gulmarg
Gulmarg (translation: "Meadow of Flowers") is a town, a hill station, a popular skiing destination and a notified area committee in Baramula district in the Indian state of Jammu and Kashmir. The town is sitiuated in the Pir Pinjal range in the weste..
Gulmarg Wikipedia Page


About Our Data
The data on this page is estimated using a number of publicly available tools and resources. It is provided without warranty, and could contain inaccuracies. Use at your own risk.