Categories in Kakching
Industries
Business Distribution by Industry in Kakching
| Industry Description | Number of Establishments |
|---|---|
| Shopping | 143 |
| Education | 111 |
| Churches | 78 |
| Playground | 66 |
| Religion | 63 |
| Apartments | 57 |
| Travel and transportation | 55 |
| Electronics stores | 49 |
| Restaurants | 49 |
| Grocery stores and supermarkets | 39 |
| Shopping other | 39 |
| Hardware store | 37 |
| Other accommodation | 36 |
Kakching Facts
| Area | 232.4 km² |
| Population | 188,449 |
| Male Population | 94,084 (49.9%) |
| Female Population | 94,365 (50.1%) |
| Population change (1975 to 2020) | +124.6% |
| Population change (2000 to 2020) | +31.1% |
| Median Age | 24.9 years (Male: 24.6, Female: 25.2) |
| Neighborhoods | Sumak Leikai, Leirak Achouba Pareng, Leirak Achouba Pareng, Sumak Leikai, Makha Leika, Makha Lou, Leirak Achouba Pareng |
| Local Time | |
| Timezone | India Standard Time |
| Lat & Lng | 24.49820, 93.98126 |
| Pin Codes | 795101 |
Map of Kakching
Interactive Map
Kakching Population
Years 1975 to 2020
| Data | 1975 | 1990 | 2000 | 2015 | 2020 |
|---|---|---|---|---|---|
| Population | 83,903 | 116,911 | 143,729 | 177,181 | 188,449 |
| Population Density | 361 / km² | 503 / km² | 618.4 / km² | 762.3 / km² | 810.8 / km² |
Kakching Population change from 2000 to 2015
Increase of 23.3% from year 2000 to 2015
| Location | Change since 1975 | Change since 1990 | Change since 2000 |
|---|---|---|---|
| Kakching | +111.2% | +51.6% | +23.3% |
| Manipur | +155.7% | +72% | +35.7% |
| India | +111.1% | +50.6% | +24.5% |
Kakching Median Age
Median Age: 24.9 years
| Location | Median Age | Median Age (Female) | Median Age (Male) |
|---|---|---|---|
| Kakching | 24.9 yrs | 25.2 yrs | 24.6 yrs |
| Manipur | 24.9 yrs | 25.2 yrs | 24.6 yrs |
| India | 24.9 yrs | 25.4 yrs | 24.5 yrs |
Kakching Population Density
Population Density: 811 / km²
| Location | Population | Area | Density |
|---|---|---|---|
| Kakching | 188,449 | 232.4 km² | 811 / km² |
| Manipur | 3.2 million | 22,308.8 km² | 144 / km² |
| India | 1,307 million | 3,083,563.4 km² | 424 / km² |
Kakching Historical and Projected Population
Estimated Population from 1700 to 2100
- JRC (European Commission's Joint Research Centre) work on the GHS built-up grid
- CIESIN (Center for International Earth Science Information Network)
- [Link] Klein Goldewijk, K., Beusen, A., Doelman, J., and Stehfest, E.: Anthropogenic land use estimates for the Holocene – HYDE 3.2, Earth Syst. Sci. Data, 9, 927–953, https://doi.org/10.5194/essd-9-927-2017, 2017.
Neighborhoods in Kakching
Percentage of businesses by neighborhood in Kakching
Area Codes
Percentage Area Codes used by businesses in Kakching
Human Development Index (HDI)
Statistic composite index of life expectancy, education, and per capita income.
Kakching CO2 Emissions
Carbon Dioxide (CO2) Emissions Per Capita in Tonnes Per Year
| Location | CO2 Emissions | CO2 Emissions Per Capita | CO2 Emissions Intensity |
|---|---|---|---|
| Kakching | 220,625 tn | 1.17 tn | 949.2 tons/km² |
| Manipur | 3,768,697 tn | 1.18 tn | 168.9 tons/km² |
| India | 1,928,568,344 tn | 1.48 tn | 625.4 tons/km² |
| 2013 CO2 emissions (tonnes/year) | 220,625 tn |
| 2013 CO2 emissions (tonnes/year) per capita | 1.17 tn |
| 2013 CO2 emissions intensity (tonnes/km²/year) | 949.2 tons/km² |
Natural Hazards Risk
Relative risk out of 10
| Hazard | Risk Level |
|---|---|
| Drought | Medium (4) |
| Flood | Medium (7) |
| Earthquake | High (10) |
| Landslide | High (8) |
* Risk, particularly concerning flood or landslide, may not be for the entire area.
- Dilley, M., R.S. Chen, U. Deichmann, A.L. Lerner-Lam, M. Arnold, J. Agwe, P. Buys, O. Kjekstad, B. Lyon, and G. Yetman. 2005. Natural Disaster Hotspots: A Global Risk Analysis. Washington, D.C.: World Bank. https://doi.org/10.1596/0-8213-5930-4.
- Center for Hazards and Risk Research - CHRR - Columbia University, Center for International Earth Science Information Network - CIESIN - Columbia University, and Norwegian Geotechnical Institute - NGI. 2005. Global Landslide Hazard Distribution. Palisades, NY: NASA Socioeconomic Data and Applications Center (SEDAC). https://doi.org/10.7927/H4P848VZ.
- Center for Hazards and Risk Research - CHRR - Columbia University, Center for International Earth Science Information Network - CIESIN - Columbia University, and International Research Institute for Climate and Society - IRI - Columbia University. 2005. Global Drought Hazard Frequency and Distribution. Palisades, NY: NASA Socioeconomic Data and Applications Center (SEDAC). https://doi.org/10.7927/H4VX0DFT.
- Center for Hazards and Risk Research - CHRR - Columbia University, Center for International Earth Science Information Network - CIESIN - Columbia University. 2005. Global Flood Hazard Frequency and Distribution. Palisades, NY: NASA Socioeconomic Data and Applications Center (SEDAC). https://doi.org/10.7927/H4668B3D.
- Center for Hazards and Risk Research - CHRR - Columbia University, Center for International Earth Science Information Network - CIESIN - Columbia University. 2005. Global Earthquake Hazard Distribution - Peak Ground Acceleration. Palisades, NY: NASA Socioeconomic Data and Applications Center (SEDAC). https://doi.org/10.7927/H4BZ63ZS.
Recent Nearby Earthquakes
Magnitude 3.0 and greater
| Date▼ | Time↕ | Magnitude↕ | Distance↕ | Depth↕ | Location↕ | Link |
|---|---|---|---|---|---|---|
| 8/18/19 | 6:28 AM | 4.9 | 50.8 km | 66,440 m | 39km SE of Churachandpur, India | usgs.gov |
| 3/25/19 | 12:41 PM | 4.6 | 52 km | 56,650 m | 16km W of Churachandpur, India | usgs.gov |
| 2/3/19 | 5:20 PM | 4.5 | 10.4 km | 66,280 m | 10km S of Mayang Imphal, India | usgs.gov |
| 1/27/19 | 11:45 PM | 4.7 | 11.4 km | 65,340 m | 9km SSE of Kakching, India | usgs.gov |
| 1/27/19 | 4:49 AM | 4.7 | 47 km | 67,970 m | 28km ENE of Yairipok, India | usgs.gov |
| 1/25/19 | 5:07 PM | 4.6 | 22.8 km | 55,870 m | 21km SSW of Kakching, India | usgs.gov |
| 11/6/18 | 10:50 PM | 4.2 | 38.6 km | 64,340 m | 37km ESE of Kakching, India | usgs.gov |
| 9/25/18 | 8:51 PM | 4.2 | 28.8 km | 57,720 m | 26km ESE of Churachandpur, India | usgs.gov |
| 6/20/18 | 7:44 AM | 4.5 | 41.5 km | 67,380 m | 31km ESE of Yairipok, India | usgs.gov |
| 3/15/18 | 2:26 AM | 4.5 | 42.6 km | 55,550 m | 14km NW of Churachandpur, India | usgs.gov |
Kakching
Kakching is a town and a municipal council in Thoubal district in the Indian state of Manipur. It is the second largest town in Thoubal district and also a sub divisional headquarters of kakching sub division and a major commercial hub in Manipur. It..
Kakching Wikipedia Page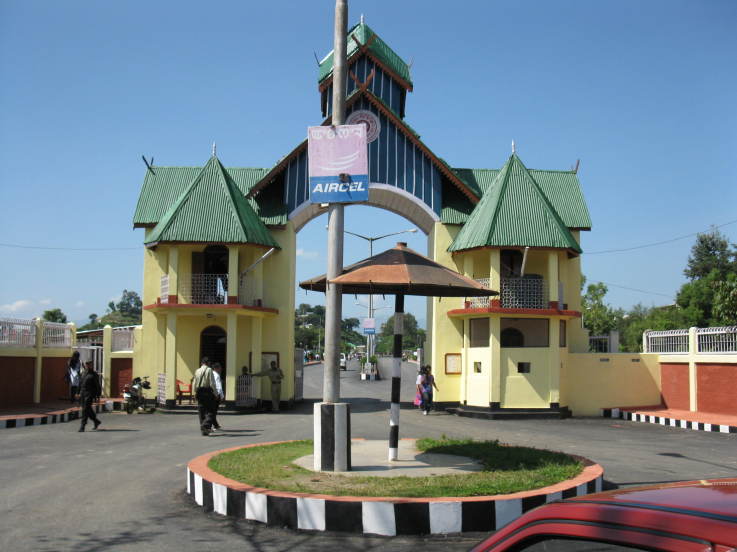

About Our Data
The data on this page is estimated using a number of publicly available tools and resources. It is provided without warranty, and could contain inaccuracies. Use at your own risk.