Categories in Kumher
Industries
Business Distribution by Industry in Kumher
| Industry Description | Number of Establishments |
|---|---|
| Shopping | 74 |
| Education | 56 |
| Electronics stores | 47 |
| Shopping other | 29 |
| Travel and transportation | 25 |
| Hindu temple | 24 |
| Grocery stores and supermarkets | 21 |
| Higher education (colleges and universities) | 17 |
| Clothing stores | 17 |
| Medical laboratories | 16 |
Kumher Facts
| Area | 440.8 km² |
| Population | 243,994 |
| Male Population | 129,602 (53.1%) |
| Female Population | 114,392 (46.9%) |
| Population change (1975 to 2020) | +234.4% |
| Population change (2000 to 2020) | +44.3% |
| Median Age | 20.7 years (Male: 20.3, Female: 21.2) |
| Neighborhoods | Bharatpur |
| Local Time | |
| Timezone | India Standard Time |
| Lat & Lng | 27.31657, 77.37079 |
Map of Kumher
Interactive Map
Kumher Population
Years 1975 to 2020
| Data | 1975 | 1990 | 2000 | 2015 | 2020 |
|---|---|---|---|---|---|
| Population | 72,960 | 131,328 | 169,049 | 228,733 | 243,994 |
| Population Density | 165.5 / km² | 298 / km² | 383.5 / km² | 519 / km² | 553.6 / km² |
Kumher Population change from 2000 to 2015
Increase of 35.3% from year 2000 to 2015
| Location | Change since 1975 | Change since 1990 | Change since 2000 |
|---|---|---|---|
| Kumher | +213.5% | +74.2% | +35.3% |
| Rajasthan | +141.7% | +63.1% | +30.2% |
| India | +111.1% | +50.6% | +24.5% |
Kumher Median Age
Median Age: 20.7 years
| Location | Median Age | Median Age (Female) | Median Age (Male) |
|---|---|---|---|
| Kumher | 20.7 yrs | 21.2 yrs | 20.3 yrs |
| Rajasthan | 22.4 yrs | 23 yrs | 21.9 yrs |
| India | 24.9 yrs | 25.4 yrs | 24.5 yrs |
Kumher Population Density
Population Density: 554 / km²
| Location | Population | Area | Density |
|---|---|---|---|
| Kumher | 243,994 | 440.8 km² | 554 / km² |
| Rajasthan | 75.3 million | 342,463 km² | 220 / km² |
| India | 1,307 million | 3,083,563.4 km² | 424 / km² |
Kumher Historical and Projected Population
Estimated Population from 0 to 2100
- JRC (European Commission's Joint Research Centre) work on the GHS built-up grid
- CIESIN (Center for International Earth Science Information Network)
- [Link] Klein Goldewijk, K., Beusen, A., Doelman, J., and Stehfest, E.: Anthropogenic land use estimates for the Holocene – HYDE 3.2, Earth Syst. Sci. Data, 9, 927–953, https://doi.org/10.5194/essd-9-927-2017, 2017.
Human Development Index (HDI)
Statistic composite index of life expectancy, education, and per capita income.
Kumher CO2 Emissions
Carbon Dioxide (CO2) Emissions Per Capita in Tonnes Per Year
| Location | CO2 Emissions | CO2 Emissions Per Capita | CO2 Emissions Intensity |
|---|---|---|---|
| Kumher | 351,919 tn | 1.44 tn | 798.5 tons/km² |
| Rajasthan | 105,422,055 tn | 1.4 tn | 307.8 tons/km² |
| India | 1,928,568,344 tn | 1.48 tn | 625.4 tons/km² |
| 2013 CO2 emissions (tonnes/year) | 351,919 tn |
| 2013 CO2 emissions (tonnes/year) per capita | 1.44 tn |
| 2013 CO2 emissions intensity (tonnes/km²/year) | 798.5 tons/km² |
Natural Hazards Risk
Relative risk out of 10
| Hazard | Risk Level |
|---|---|
| Drought | High (9.3) |
| Flood | High (10) |
| Earthquake | Low (2.9) |
* Risk, particularly concerning flood or landslide, may not be for the entire area.
- Dilley, M., R.S. Chen, U. Deichmann, A.L. Lerner-Lam, M. Arnold, J. Agwe, P. Buys, O. Kjekstad, B. Lyon, and G. Yetman. 2005. Natural Disaster Hotspots: A Global Risk Analysis. Washington, D.C.: World Bank. https://doi.org/10.1596/0-8213-5930-4.
- Center for Hazards and Risk Research - CHRR - Columbia University, Center for International Earth Science Information Network - CIESIN - Columbia University, and International Research Institute for Climate and Society - IRI - Columbia University. 2005. Global Drought Hazard Frequency and Distribution. Palisades, NY: NASA Socioeconomic Data and Applications Center (SEDAC). https://doi.org/10.7927/H4VX0DFT.
- Center for Hazards and Risk Research - CHRR - Columbia University, Center for International Earth Science Information Network - CIESIN - Columbia University. 2005. Global Flood Hazard Frequency and Distribution. Palisades, NY: NASA Socioeconomic Data and Applications Center (SEDAC). https://doi.org/10.7927/H4668B3D.
- Center for Hazards and Risk Research - CHRR - Columbia University, Center for International Earth Science Information Network - CIESIN - Columbia University. 2005. Global Earthquake Hazard Distribution - Peak Ground Acceleration. Palisades, NY: NASA Socioeconomic Data and Applications Center (SEDAC). https://doi.org/10.7927/H4BZ63ZS.
Recent Nearby Earthquakes
Magnitude 3.0 and greater
| Date▼ | Time↕ | Magnitude↕ | Distance↕ | Depth↕ | Location↕ | Link |
|---|---|---|---|---|---|---|
| 3/16/19 | 11:41 PM | 4 | 53.2 km | 10,000 m | 11km W of Govindgarh, India | usgs.gov |
| 10/18/07 | 5:54 AM | 4.7 | 58.1 km | 10,000 m | Rajasthan-Uttar Pradesh border region, India | usgs.gov |
| 11/29/06 | 5:41 AM | 4 | 53.6 km | 10,000 m | Rajasthan, India | usgs.gov |
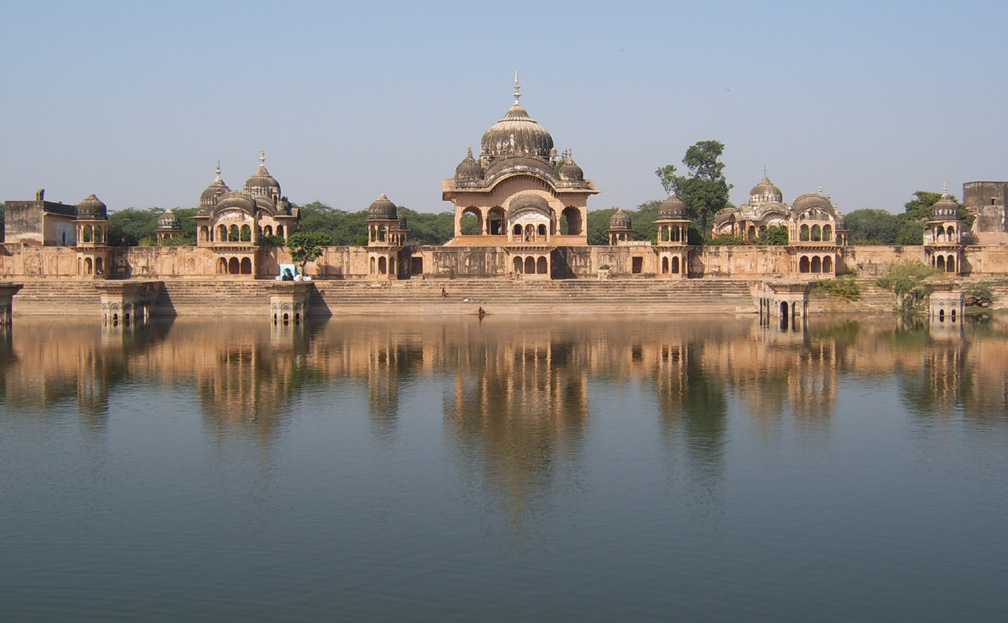
Kumher
Kumher is a historical city and municipality in the Bharatpur district of Rajasthan, India. It was founded by a Jat chieftain Kumbh.
Kumher Wikipedia Page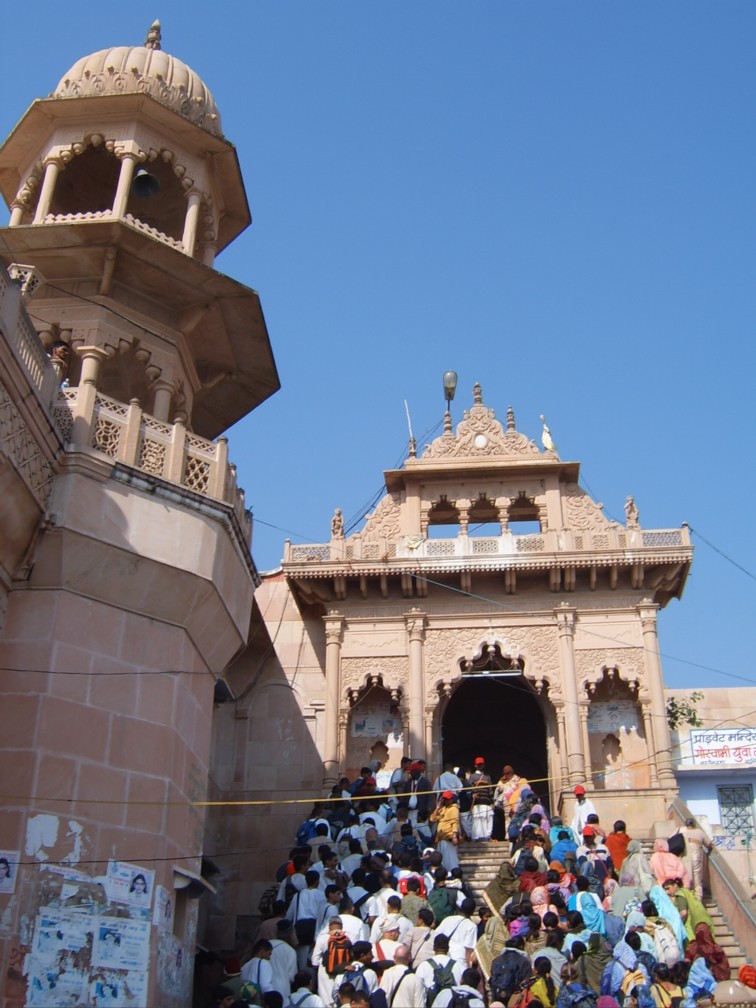
About Our Data
The data on this page is estimated using a number of publicly available tools and resources. It is provided without warranty, and could contain inaccuracies. Use at your own risk.