Categories in Munnar
Industries
Business Distribution by Industry in Munnar
| Industry Description | Number of Establishments |
|---|---|
| Other accommodation | 474 |
| Hotels and motels | 346 |
| Travel agencies | 144 |
| Restaurants | 98 |
| Travel and transportation | 58 |
| Shopping | 57 |
| Tour operators | 54 |
| Holiday homes, cabins and resorts | 45 |
Munnar Facts
| Area | 33.8 km² |
| Population | 20,070 |
| Male Population | 10,039 (50.0%) |
| Female Population | 10,031 (50.0%) |
| Population change (1975 to 2020) | -93.1% |
| Population change (2000 to 2020) | -54.0% |
| Median Age | 33.6 years (Male: 32.9, Female: 34.2) |
| Area Codes | 4865 |
| Neighborhoods | Nullatanni, Moolakadai, Silent Valley, Ikka Nagar, New Colony |
| Local Time | |
| Timezone | India Standard Time |
| Lat & Lng | 10.08873, 77.06269 |
Map of Munnar
Interactive Map
Munnar Population
Years 1975 to 2020
| Data | 1975 | 1990 | 2000 | 2015 | 2020 |
|---|---|---|---|---|---|
| Population | 291,704 | 33,561 | 43,619 | 19,097 | 20,070 |
| Population Density | 8,643.1 / km² | 994.4 / km² | 1,292.4 / km² | 565.8 / km² | 594.7 / km² |
Munnar Population change from 2000 to 2015
Decrease of 56.2% from year 2000 to 2015
| Location | Change since 1975 | Change since 1990 | Change since 2000 |
|---|---|---|---|
| Munnar | -93.5% | -43.1% | -56.2% |
| Kerala | +36.8% | +14% | +4.9% |
| India | +111.1% | +50.6% | +24.5% |
Munnar Median Age
Median Age: 33.6 years
| Location | Median Age | Median Age (Female) | Median Age (Male) |
|---|---|---|---|
| Munnar | 33.6 yrs | 34.2 yrs | 32.9 yrs |
| Kerala | 32 yrs | 33 yrs | 30.9 yrs |
| India | 24.9 yrs | 25.4 yrs | 24.5 yrs |
Munnar Population Density
Population Density: 595 / km²
| Location | Population | Area | Density |
|---|---|---|---|
| Munnar | 20,070 | 33.8 km² | 595 / km² |
| Kerala | 33.8 million | 38,821.4 km² | 872 / km² |
| India | 1,307 million | 3,083,563.4 km² | 424 / km² |
Munnar Historical and Projected Population
Estimated Population from 0 to 2100
- JRC (European Commission's Joint Research Centre) work on the GHS built-up grid
- CIESIN (Center for International Earth Science Information Network)
- [Link] Klein Goldewijk, K., Beusen, A., Doelman, J., and Stehfest, E.: Anthropogenic land use estimates for the Holocene – HYDE 3.2, Earth Syst. Sci. Data, 9, 927–953, https://doi.org/10.5194/essd-9-927-2017, 2017.
Neighborhoods in Munnar
Percentage of businesses by neighborhood in Munnar
Area Codes
Percentage Area Codes used by businesses in Munnar
Pin Codes
Percentage of businesses by Postal Codes in Munnar
Price Distribution
Business distribution by price for Munnar
Human Development Index (HDI)
Statistic composite index of life expectancy, education, and per capita income.
Munnar CO2 Emissions
Carbon Dioxide (CO2) Emissions Per Capita in Tonnes Per Year
| Location | CO2 Emissions | CO2 Emissions Per Capita | CO2 Emissions Intensity |
|---|---|---|---|
| Munnar | 38,582 tn | 1.92 tn | 1,143.2 tons/km² |
| Kerala | 62,962,414 tn | 1.86 tn | 1,621.8 tons/km² |
| India | 1,928,568,344 tn | 1.48 tn | 625.4 tons/km² |
| 2013 CO2 emissions (tonnes/year) | 38,582 tn |
| 2013 CO2 emissions (tonnes/year) per capita | 1.92 tn |
| 2013 CO2 emissions intensity (tonnes/km²/year) | 1,143.2 tons/km² |
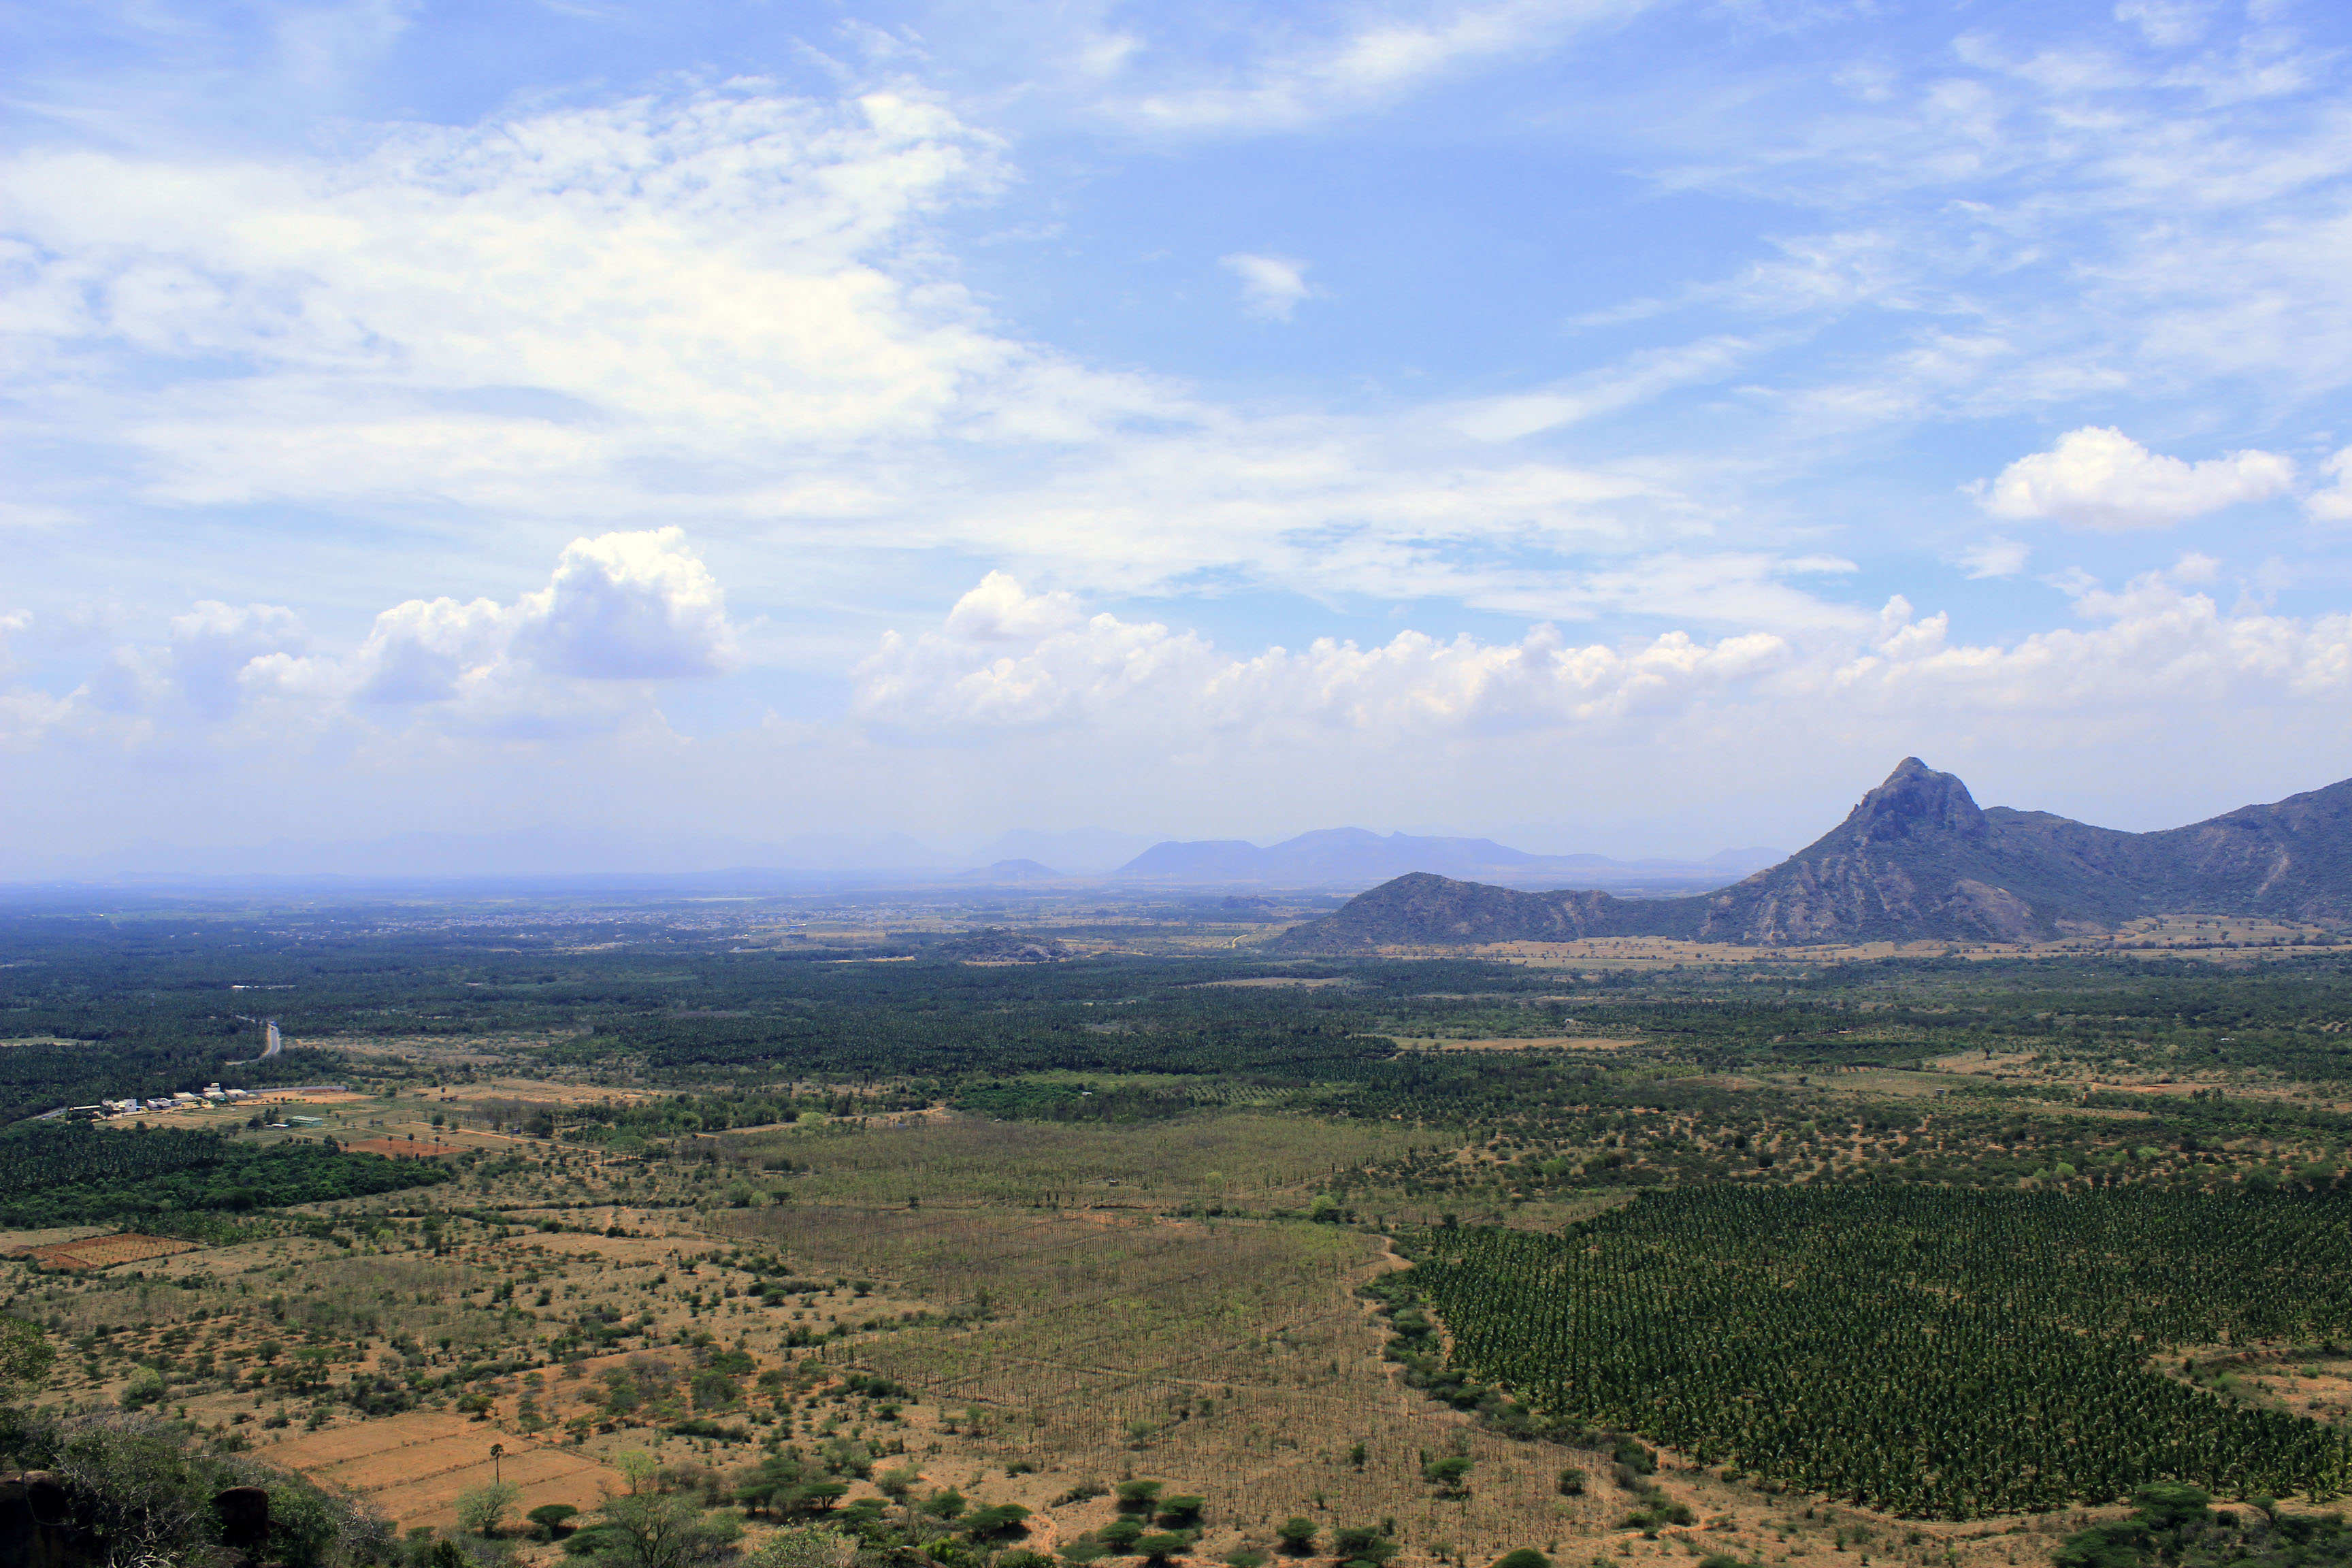
Munnar
Munnar is a town and hill station located in the Idukki district of the southwestern Indian state of Kerala. Munnar is situated at around 1,600 metres (5,200 ft) above sea level, in the Western Ghats range of mountains. name Munnar is believed to me..
Munnar Wikipedia Page

About Our Data
The data on this page is estimated using a number of publicly available tools and resources. It is provided without warranty, and could contain inaccuracies. Use at your own risk.