Industries
Business Distribution by Industry in Nungba
| Industry Description | Number of Establishments |
|---|---|
| Churches | 8 |
Nungba Facts
| Area | 920.9 km² |
| Population | 41,677 |
| Male Population | 21,473 (51.5%) |
| Female Population | 20,204 (48.5%) |
| Population change (1975 to 2020) | +185.1% |
| Population change (2000 to 2020) | +35.5% |
| Median Age | 22.9 years (Male: 23, Female: 22.9) |
| Local Time | |
| Timezone | India Standard Time |
| Lat & Lng | 24.74349, 93.41751 |
Map of Nungba
Interactive Map
Nungba Population
Years 1975 to 2020
| Data | 1975 | 1990 | 2000 | 2015 | 2020 |
|---|---|---|---|---|---|
| Population | 14,617 | 23,711 | 30,747 | 39,781 | 41,677 |
| Population Density | 15.9 / km² | 25.7 / km² | 33.4 / km² | 43.2 / km² | 45.3 / km² |
Nungba Population change from 2000 to 2015
Increase of 29.4% from year 2000 to 2015
| Location | Change since 1975 | Change since 1990 | Change since 2000 |
|---|---|---|---|
| Nungba | +172.2% | +67.8% | +29.4% |
| Manipur | +155.7% | +72% | +35.7% |
| India | +111.1% | +50.6% | +24.5% |
Nungba Median Age
Median Age: 22.9 years
| Location | Median Age | Median Age (Female) | Median Age (Male) |
|---|---|---|---|
| Nungba | 22.9 yrs | 22.9 yrs | 23 yrs |
| Manipur | 24.9 yrs | 25.2 yrs | 24.6 yrs |
| India | 24.9 yrs | 25.4 yrs | 24.5 yrs |
Nungba Population Density
Population Density: 45.3 / km²
| Location | Population | Area | Density |
|---|---|---|---|
| Nungba | 41,677 | 920.9 km² | 45.3 / km² |
| Manipur | 3.2 million | 22,308.8 km² | 144 / km² |
| India | 1,307 million | 3,083,563.4 km² | 424 / km² |
Nungba Historical and Projected Population
Estimated Population from 0 to 2100
- JRC (European Commission's Joint Research Centre) work on the GHS built-up grid
- CIESIN (Center for International Earth Science Information Network)
- [Link] Klein Goldewijk, K., Beusen, A., Doelman, J., and Stehfest, E.: Anthropogenic land use estimates for the Holocene – HYDE 3.2, Earth Syst. Sci. Data, 9, 927–953, https://doi.org/10.5194/essd-9-927-2017, 2017.
Human Development Index (HDI)
Statistic composite index of life expectancy, education, and per capita income.
Nungba CO2 Emissions
Carbon Dioxide (CO2) Emissions Per Capita in Tonnes Per Year
| Location | CO2 Emissions | CO2 Emissions Per Capita | CO2 Emissions Intensity |
|---|---|---|---|
| Nungba | 50,695 tn | 1.22 tn | 55.1 tons/km² |
| Manipur | 3,768,697 tn | 1.18 tn | 168.9 tons/km² |
| India | 1,928,568,344 tn | 1.48 tn | 625.4 tons/km² |
| 2013 CO2 emissions (tonnes/year) | 50,695 tn |
| 2013 CO2 emissions (tonnes/year) per capita | 1.22 tn |
| 2013 CO2 emissions intensity (tonnes/km²/year) | 55.1 tons/km² |
Natural Hazards Risk
Relative risk out of 10
| Hazard | Risk Level |
|---|---|
| Drought | Medium (4) |
| Flood | Medium (7) |
| Earthquake | High (9) |
| Landslide | High (10) |
* Risk, particularly concerning flood or landslide, may not be for the entire area.
- Dilley, M., R.S. Chen, U. Deichmann, A.L. Lerner-Lam, M. Arnold, J. Agwe, P. Buys, O. Kjekstad, B. Lyon, and G. Yetman. 2005. Natural Disaster Hotspots: A Global Risk Analysis. Washington, D.C.: World Bank. https://doi.org/10.1596/0-8213-5930-4.
- Center for Hazards and Risk Research - CHRR - Columbia University, Center for International Earth Science Information Network - CIESIN - Columbia University, and Norwegian Geotechnical Institute - NGI. 2005. Global Landslide Hazard Distribution. Palisades, NY: NASA Socioeconomic Data and Applications Center (SEDAC). https://doi.org/10.7927/H4P848VZ.
- Center for Hazards and Risk Research - CHRR - Columbia University, Center for International Earth Science Information Network - CIESIN - Columbia University, and International Research Institute for Climate and Society - IRI - Columbia University. 2005. Global Drought Hazard Frequency and Distribution. Palisades, NY: NASA Socioeconomic Data and Applications Center (SEDAC). https://doi.org/10.7927/H4VX0DFT.
- Center for Hazards and Risk Research - CHRR - Columbia University, Center for International Earth Science Information Network - CIESIN - Columbia University. 2005. Global Flood Hazard Frequency and Distribution. Palisades, NY: NASA Socioeconomic Data and Applications Center (SEDAC). https://doi.org/10.7927/H4668B3D.
- Center for Hazards and Risk Research - CHRR - Columbia University, Center for International Earth Science Information Network - CIESIN - Columbia University. 2005. Global Earthquake Hazard Distribution - Peak Ground Acceleration. Palisades, NY: NASA Socioeconomic Data and Applications Center (SEDAC). https://doi.org/10.7927/H4BZ63ZS.
Recent Nearby Earthquakes
Magnitude 3.0 and greater
| Date▼ | Time↕ | Magnitude↕ | Distance↕ | Depth↕ | Location↕ | Link |
|---|---|---|---|---|---|---|
| 8/18/19 | 6:28 AM | 4.9 | 91.4 km | 66,440 m | 39km SE of Churachandpur, India | usgs.gov |
| 3/25/19 | 12:41 PM | 4.6 | 47.9 km | 56,650 m | 16km W of Churachandpur, India | usgs.gov |
| 2/3/19 | 5:20 PM | 4.5 | 53 km | 66,280 m | 10km S of Mayang Imphal, India | usgs.gov |
| 1/27/19 | 11:45 PM | 4.7 | 72.1 km | 65,340 m | 9km SSE of Kakching, India | usgs.gov |
| 1/27/19 | 4:49 AM | 4.7 | 89.8 km | 67,970 m | 28km ENE of Yairipok, India | usgs.gov |
| 1/25/19 | 5:07 PM | 4.6 | 68 km | 55,870 m | 21km SSW of Kakching, India | usgs.gov |
| 11/10/18 | 5:15 PM | 5.2 | 85.4 km | 52,390 m | 48km SW of Churachandpur, India | usgs.gov |
| 9/25/18 | 8:51 PM | 4.2 | 74.6 km | 57,720 m | 26km ESE of Churachandpur, India | usgs.gov |
| 3/15/18 | 2:26 AM | 4.5 | 38.5 km | 55,550 m | 14km NW of Churachandpur, India | usgs.gov |
| 8/8/17 | 12:35 AM | 4.2 | 49.6 km | 62,840 m | 12km WSW of Churachandpur, India | usgs.gov |
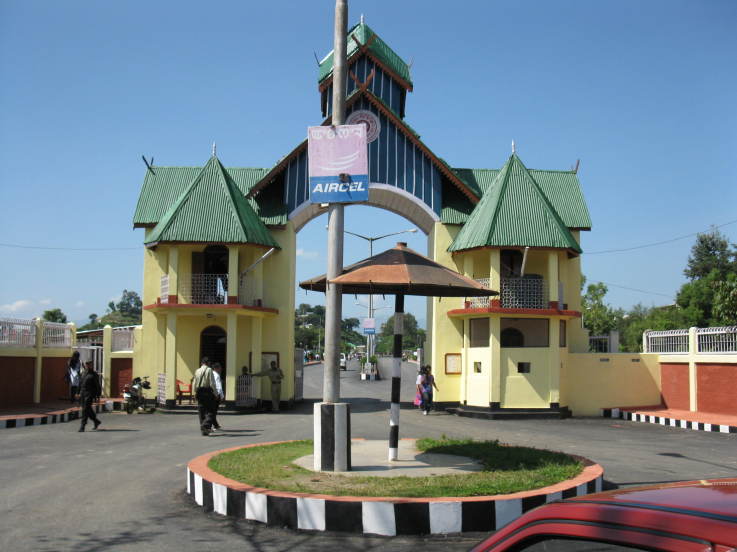
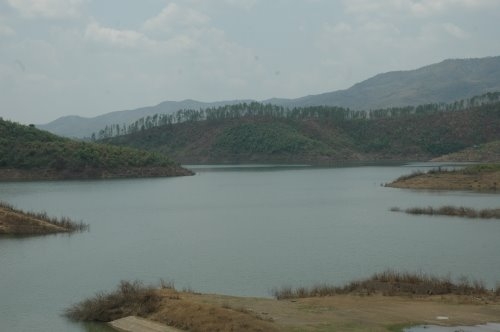
Nungba
Nungba (originally "Lwangba") is a small scenic town surrounded by a low lying hill ranges and rivers, an extension of eastern Indian Himalayas. It has a pleasant and comfortable climatic conditions throughout the year with temperature ranging betwee..
Nungba Wikipedia Page

About Our Data
The data on this page is estimated using a number of publicly available tools and resources. It is provided without warranty, and could contain inaccuracies. Use at your own risk.