Categories in Phulera
Industries
Business Distribution by Industry in Phulera
| Industry Description | Number of Establishments |
|---|---|
| Shopping | 171 |
| Education | 69 |
| Shopping other | 61 |
| Electronics stores | 59 |
| Clothing stores | 56 |
| Hindu temple | 38 |
| Restaurants | 35 |
| Grocery stores and supermarkets | 31 |
| Beauty salons | 27 |
Phulera Facts
| Area | 1391.2 km² |
| Population | 555,201 |
| Male Population | 288,046 (51.9%) |
| Female Population | 267,155 (48.1%) |
| Population change (1975 to 2020) | +204.1% |
| Population change (2000 to 2020) | +47.9% |
| Median Age | 23.4 years (Male: 22.9, Female: 23.9) |
| Area Codes | 1424, 1425 |
| Neighborhoods | Jagadamba Colony, Shyam Nagar, Railway Colony, Gangori Bazar, School Ki Dhani |
| Local Time | |
| Timezone | India Standard Time |
| Lat & Lng | 26.87401, 75.24171 |
Map of Phulera
Interactive Map
Phulera Population
Years 1975 to 2020
| Data | 1975 | 1990 | 2000 | 2015 | 2020 |
|---|---|---|---|---|---|
| Population | 182,583 | 287,314 | 375,462 | 520,129 | 555,201 |
| Population Density | 131.2 / km² | 206.5 / km² | 269.9 / km² | 373.9 / km² | 399.1 / km² |
Phulera Population change from 2000 to 2015
Increase of 38.5% from year 2000 to 2015
| Location | Change since 1975 | Change since 1990 | Change since 2000 |
|---|---|---|---|
| Phulera | +184.9% | +81% | +38.5% |
| Rajasthan | +141.7% | +63.1% | +30.2% |
| India | +111.1% | +50.6% | +24.5% |
Phulera Median Age
Median Age: 23.4 years
| Location | Median Age | Median Age (Female) | Median Age (Male) |
|---|---|---|---|
| Phulera | 23.4 yrs | 23.9 yrs | 22.9 yrs |
| Rajasthan | 22.4 yrs | 23 yrs | 21.9 yrs |
| India | 24.9 yrs | 25.4 yrs | 24.5 yrs |
Phulera Population Density
Population Density: 399 / km²
| Location | Population | Area | Density |
|---|---|---|---|
| Phulera | 555,201 | 1,391.2 km² | 399 / km² |
| Rajasthan | 75.3 million | 342,463 km² | 220 / km² |
| India | 1,307 million | 3,083,563.4 km² | 424 / km² |
Phulera Historical and Projected Population
Estimated Population from 1700 to 2100
- JRC (European Commission's Joint Research Centre) work on the GHS built-up grid
- CIESIN (Center for International Earth Science Information Network)
- [Link] Klein Goldewijk, K., Beusen, A., Doelman, J., and Stehfest, E.: Anthropogenic land use estimates for the Holocene – HYDE 3.2, Earth Syst. Sci. Data, 9, 927–953, https://doi.org/10.5194/essd-9-927-2017, 2017.
Neighborhoods in Phulera
Percentage of businesses by neighborhood in Phulera
Area Codes
Percentage Area Codes used by businesses in Phulera
Pin Codes
Percentage of businesses by Postal Codes in Phulera
Human Development Index (HDI)
Statistic composite index of life expectancy, education, and per capita income.
Phulera CO2 Emissions
Carbon Dioxide (CO2) Emissions Per Capita in Tonnes Per Year
| Location | CO2 Emissions | CO2 Emissions Per Capita | CO2 Emissions Intensity |
|---|---|---|---|
| Phulera | 990,834 tn | 1.78 tn | 712.2 tons/km² |
| Rajasthan | 105,422,055 tn | 1.4 tn | 307.8 tons/km² |
| India | 1,928,568,344 tn | 1.48 tn | 625.4 tons/km² |
| 2013 CO2 emissions (tonnes/year) | 990,834 tn |
| 2013 CO2 emissions (tonnes/year) per capita | 1.78 tn |
| 2013 CO2 emissions intensity (tonnes/km²/year) | 712.2 tons/km² |
Natural Hazards Risk
Relative risk out of 10
| Hazard | Risk Level |
|---|---|
| Drought | High (10) |
| Earthquake | Low (2) |
* Risk, particularly concerning flood or landslide, may not be for the entire area.
- Dilley, M., R.S. Chen, U. Deichmann, A.L. Lerner-Lam, M. Arnold, J. Agwe, P. Buys, O. Kjekstad, B. Lyon, and G. Yetman. 2005. Natural Disaster Hotspots: A Global Risk Analysis. Washington, D.C.: World Bank. https://doi.org/10.1596/0-8213-5930-4.
- Center for Hazards and Risk Research - CHRR - Columbia University, Center for International Earth Science Information Network - CIESIN - Columbia University, and International Research Institute for Climate and Society - IRI - Columbia University. 2005. Global Drought Hazard Frequency and Distribution. Palisades, NY: NASA Socioeconomic Data and Applications Center (SEDAC). https://doi.org/10.7927/H4VX0DFT.
- Center for Hazards and Risk Research - CHRR - Columbia University, Center for International Earth Science Information Network - CIESIN - Columbia University. 2005. Global Earthquake Hazard Distribution - Peak Ground Acceleration. Palisades, NY: NASA Socioeconomic Data and Applications Center (SEDAC). https://doi.org/10.7927/H4BZ63ZS.
Recent Nearby Earthquakes
Magnitude 3.0 and greater
| Date▼ | Time↕ | Magnitude↕ | Distance↕ | Depth↕ | Location↕ | Link |
|---|---|---|---|---|---|---|
| 9/3/15 | 5:57 PM | 4 | 61 km | 14,200 m | 7km WNW of Ringas, India | usgs.gov |
| 2/24/13 | 12:57 AM | 3.6 | 49.8 km | 10,000 m | 12km SW of Ringas, India | usgs.gov |
| 12/24/06 | 10:43 PM | 4.2 | 90.7 km | 10,000 m | Rajasthan, India | usgs.gov |
| 8/10/03 | 11:17 AM | 4.5 | 62.2 km | 10,000 m | Rajasthan, India | usgs.gov |
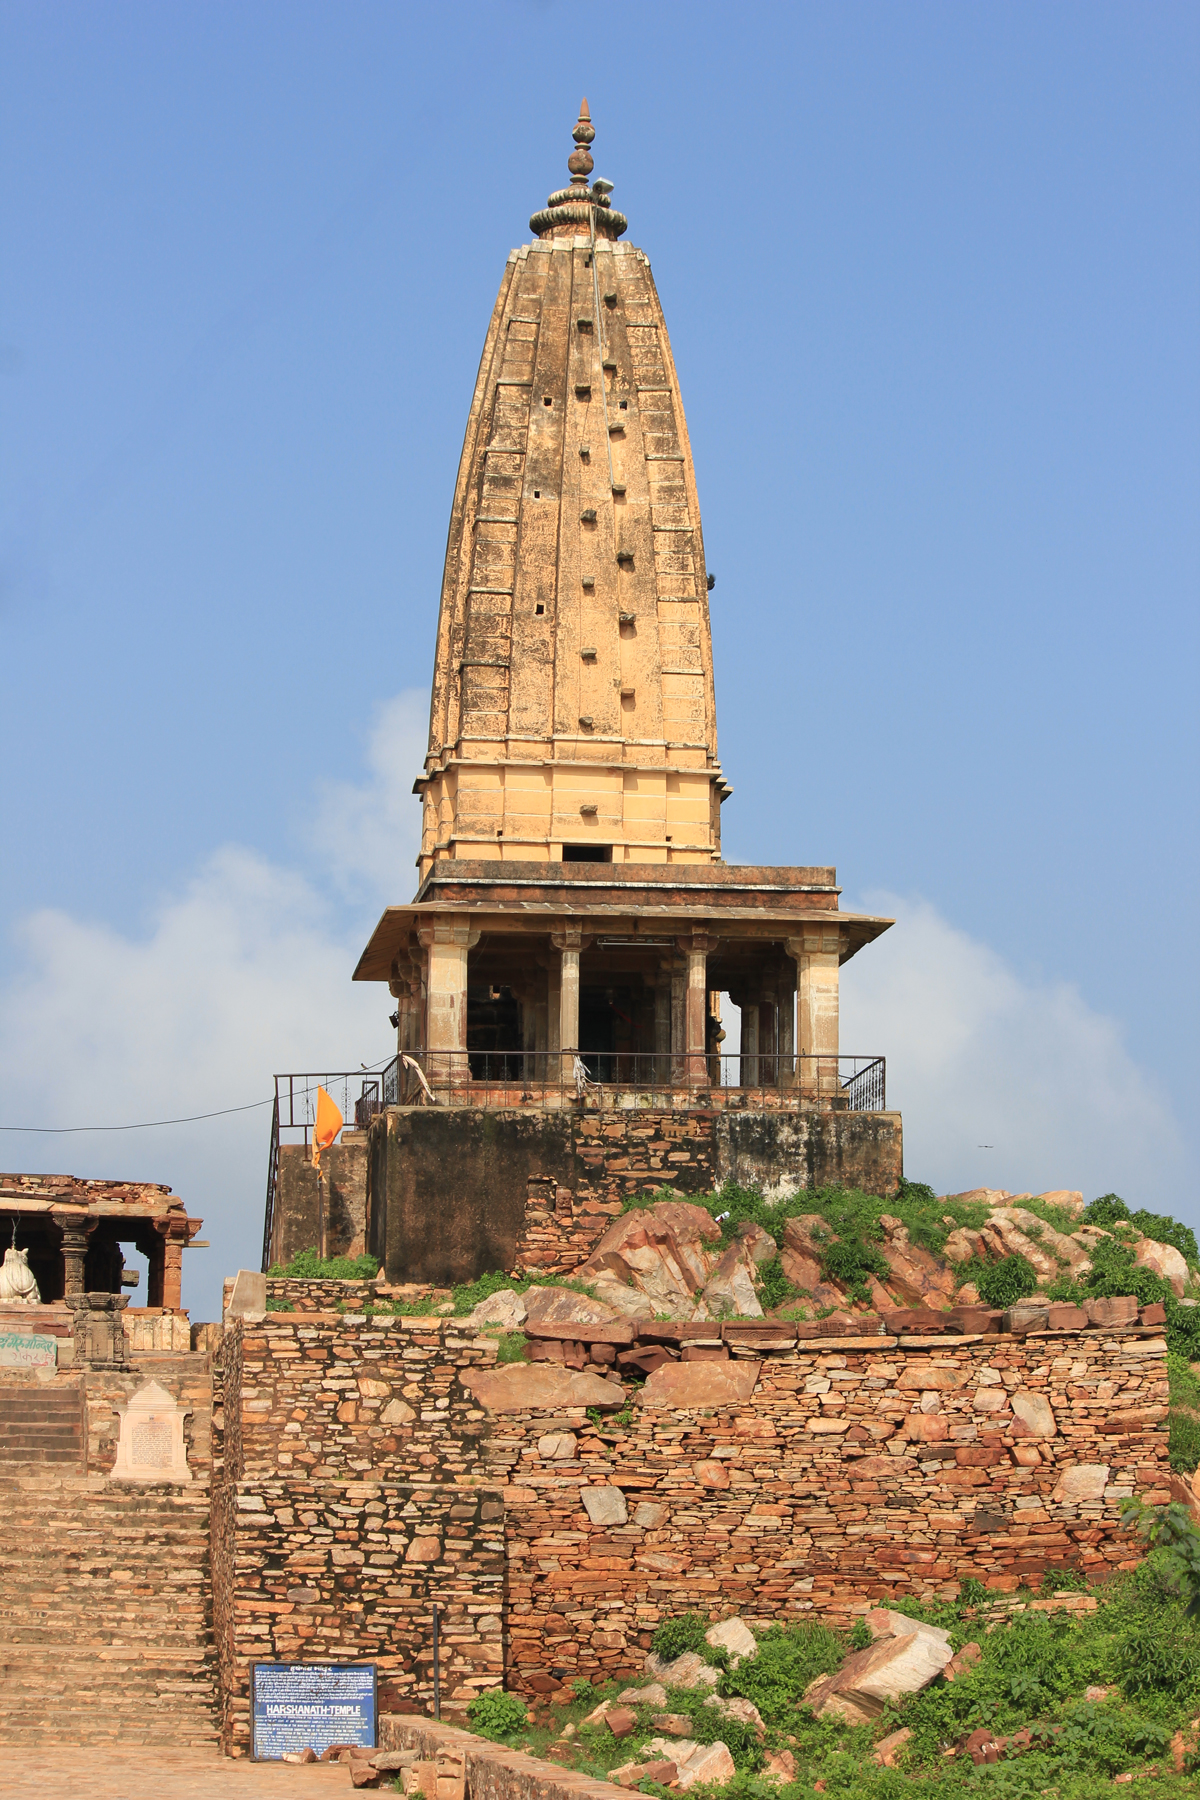
Phulera
Phulera is a city and a municipality in Jaipur district in the Indian state of Rajasthan. The DMIC (Delhi-Mumbai Industrial Corridor) project which is undertaken by Indian government runs through Phulera.
Phulera Wikipedia Page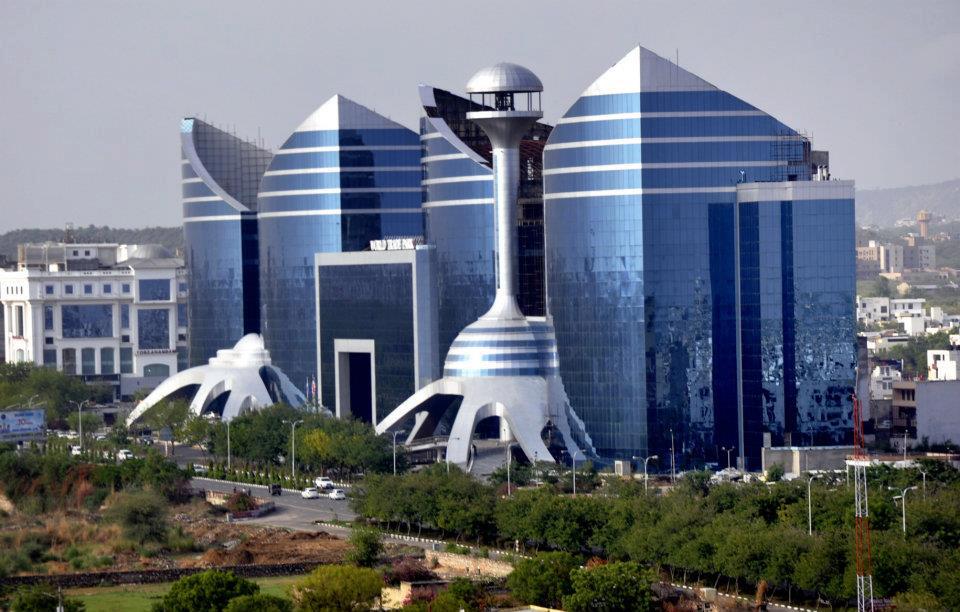

About Our Data
The data on this page is estimated using a number of publicly available tools and resources. It is provided without warranty, and could contain inaccuracies. Use at your own risk.