Categories in Sadri
Industries
Business Distribution by Industry in Sadri
| Industry Description | Number of Establishments |
|---|---|
| Hindu temple | 117 |
| Shopping | 79 |
| Education | 69 |
| Restaurants | 56 |
| Electronics stores | 43 |
| Religion | 38 |
| Travel and transportation | 36 |
| Clothing stores | 31 |
| Other accommodation | 30 |
| Apartments | 29 |
| Grocery stores and supermarkets | 26 |
| Tractors and farm equipment | 23 |
| Shopping other | 22 |
Sadri Facts
| Area | 3.9 km² |
| Population | 34,777 |
| Male Population | 17,499 (50.3%) |
| Female Population | 17,278 (49.7%) |
| Population change (1975 to 2020) | +63.5% |
| Population change (2000 to 2020) | +16.6% |
| Median Age | 23.1 years (Male: 22.3, Female: 23.9) |
| Neighborhoods | Shri Mahaveer Nagar, Chand Nagar, Garasiya Bas, Rajput Colony, Vishwakarma Colony |
| Local Time | |
| Timezone | India Standard Time |
| Lat & Lng | 25.18555, 73.45288 |
| Pin Codes | 306702 |
Map of Sadri
Interactive Map
Sadri Population
Years 1975 to 2020
| Data | 1975 | 1990 | 2000 | 2015 | 2020 |
|---|---|---|---|---|---|
| Population | 21,273 | 26,176 | 29,826 | 32,609 | 34,777 |
| Population Density | 5,402.7 / km² | 6,647.9 / km² | 7,574.9 / km² | 8,281.7 / km² | 8,832.3 / km² |
Sadri Population change from 2000 to 2015
Increase of 9.3% from year 2000 to 2015
| Location | Change since 1975 | Change since 1990 | Change since 2000 |
|---|---|---|---|
| Sadri | +53.3% | +24.6% | +9.3% |
| Rajasthan | +141.7% | +63.1% | +30.2% |
| India | +111.1% | +50.6% | +24.5% |
Sadri Median Age
Median Age: 23.1 years
| Location | Median Age | Median Age (Female) | Median Age (Male) |
|---|---|---|---|
| Sadri | 23.1 yrs | 23.9 yrs | 22.3 yrs |
| Rajasthan | 22.4 yrs | 23 yrs | 21.9 yrs |
| India | 24.9 yrs | 25.4 yrs | 24.5 yrs |
Sadri Population Density
Population Density: 8,832 / km²
| Location | Population | Area | Density |
|---|---|---|---|
| Sadri | 34,777 | 3.938 km² | 8,832 / km² |
| Rajasthan | 75.3 million | 342,463 km² | 220 / km² |
| India | 1,307 million | 3,083,563.4 km² | 424 / km² |
Sadri Historical and Projected Population
Estimated Population from 0 to 2100
- JRC (European Commission's Joint Research Centre) work on the GHS built-up grid
- CIESIN (Center for International Earth Science Information Network)
- [Link] Klein Goldewijk, K., Beusen, A., Doelman, J., and Stehfest, E.: Anthropogenic land use estimates for the Holocene – HYDE 3.2, Earth Syst. Sci. Data, 9, 927–953, https://doi.org/10.5194/essd-9-927-2017, 2017.
Neighborhoods in Sadri
Percentage of businesses by neighborhood in Sadri
Area Codes
Percentage Area Codes used by businesses in Sadri
Pin Codes
Percentage of businesses by Postal Codes in Sadri
Human Development Index (HDI)
Statistic composite index of life expectancy, education, and per capita income.
Sadri CO2 Emissions
Carbon Dioxide (CO2) Emissions Per Capita in Tonnes Per Year
| Location | CO2 Emissions | CO2 Emissions Per Capita | CO2 Emissions Intensity |
|---|---|---|---|
| Sadri | 49,641 tn | 1.43 tn | 12,607.1 tons/km² |
| Rajasthan | 105,422,055 tn | 1.4 tn | 307.8 tons/km² |
| India | 1,928,568,344 tn | 1.48 tn | 625.4 tons/km² |
| 2013 CO2 emissions (tonnes/year) | 49,641 tn |
| 2013 CO2 emissions (tonnes/year) per capita | 1.43 tn |
| 2013 CO2 emissions intensity (tonnes/km²/year) | 12,607.1 tons/km² |
Natural Hazards Risk
Relative risk out of 10
| Hazard | Risk Level |
|---|---|
| Drought | High (10) |
| Earthquake | Low (2) |
* Risk, particularly concerning flood or landslide, may not be for the entire area.
- Dilley, M., R.S. Chen, U. Deichmann, A.L. Lerner-Lam, M. Arnold, J. Agwe, P. Buys, O. Kjekstad, B. Lyon, and G. Yetman. 2005. Natural Disaster Hotspots: A Global Risk Analysis. Washington, D.C.: World Bank. https://doi.org/10.1596/0-8213-5930-4.
- Center for Hazards and Risk Research - CHRR - Columbia University, Center for International Earth Science Information Network - CIESIN - Columbia University, and International Research Institute for Climate and Society - IRI - Columbia University. 2005. Global Drought Hazard Frequency and Distribution. Palisades, NY: NASA Socioeconomic Data and Applications Center (SEDAC). https://doi.org/10.7927/H4VX0DFT.
- Center for Hazards and Risk Research - CHRR - Columbia University, Center for International Earth Science Information Network - CIESIN - Columbia University. 2005. Global Earthquake Hazard Distribution - Peak Ground Acceleration. Palisades, NY: NASA Socioeconomic Data and Applications Center (SEDAC). https://doi.org/10.7927/H4BZ63ZS.
Recent Nearby Earthquakes
Magnitude 3.0 and greater
| Date▼ | Time↕ | Magnitude↕ | Distance↕ | Depth↕ | Location↕ | Link |
|---|---|---|---|---|---|---|
| 11/9/10 | 10:46 PM | 4.6 | 20.4 km | 13,500 m | Rajasthan, India | usgs.gov |
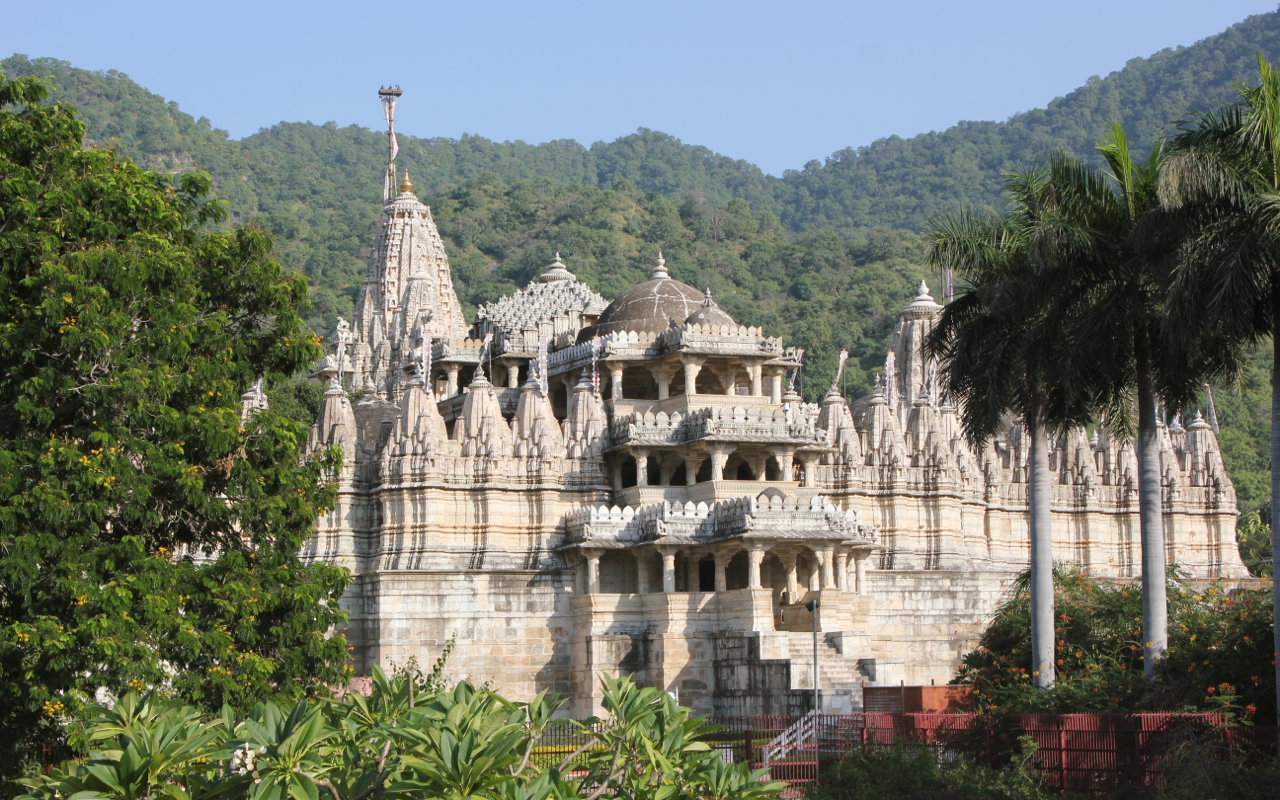
Sadri
Sadri is a town and a municipality in Pali district in the Indian state (Pali) of Rajasthan. In Past it was under of Sindhal Rathores. It's considered as gate way of Mewar to Marwar. Sadri is one of main worship place for Jain community. Sadri is lan..
Sadri Wikipedia Page

About Our Data
The data on this page is estimated using a number of publicly available tools and resources. It is provided without warranty, and could contain inaccuracies. Use at your own risk.