Categories in Sankheda
Industries
Business Distribution by Industry in Sankheda
| Industry Description | Number of Establishments |
|---|---|
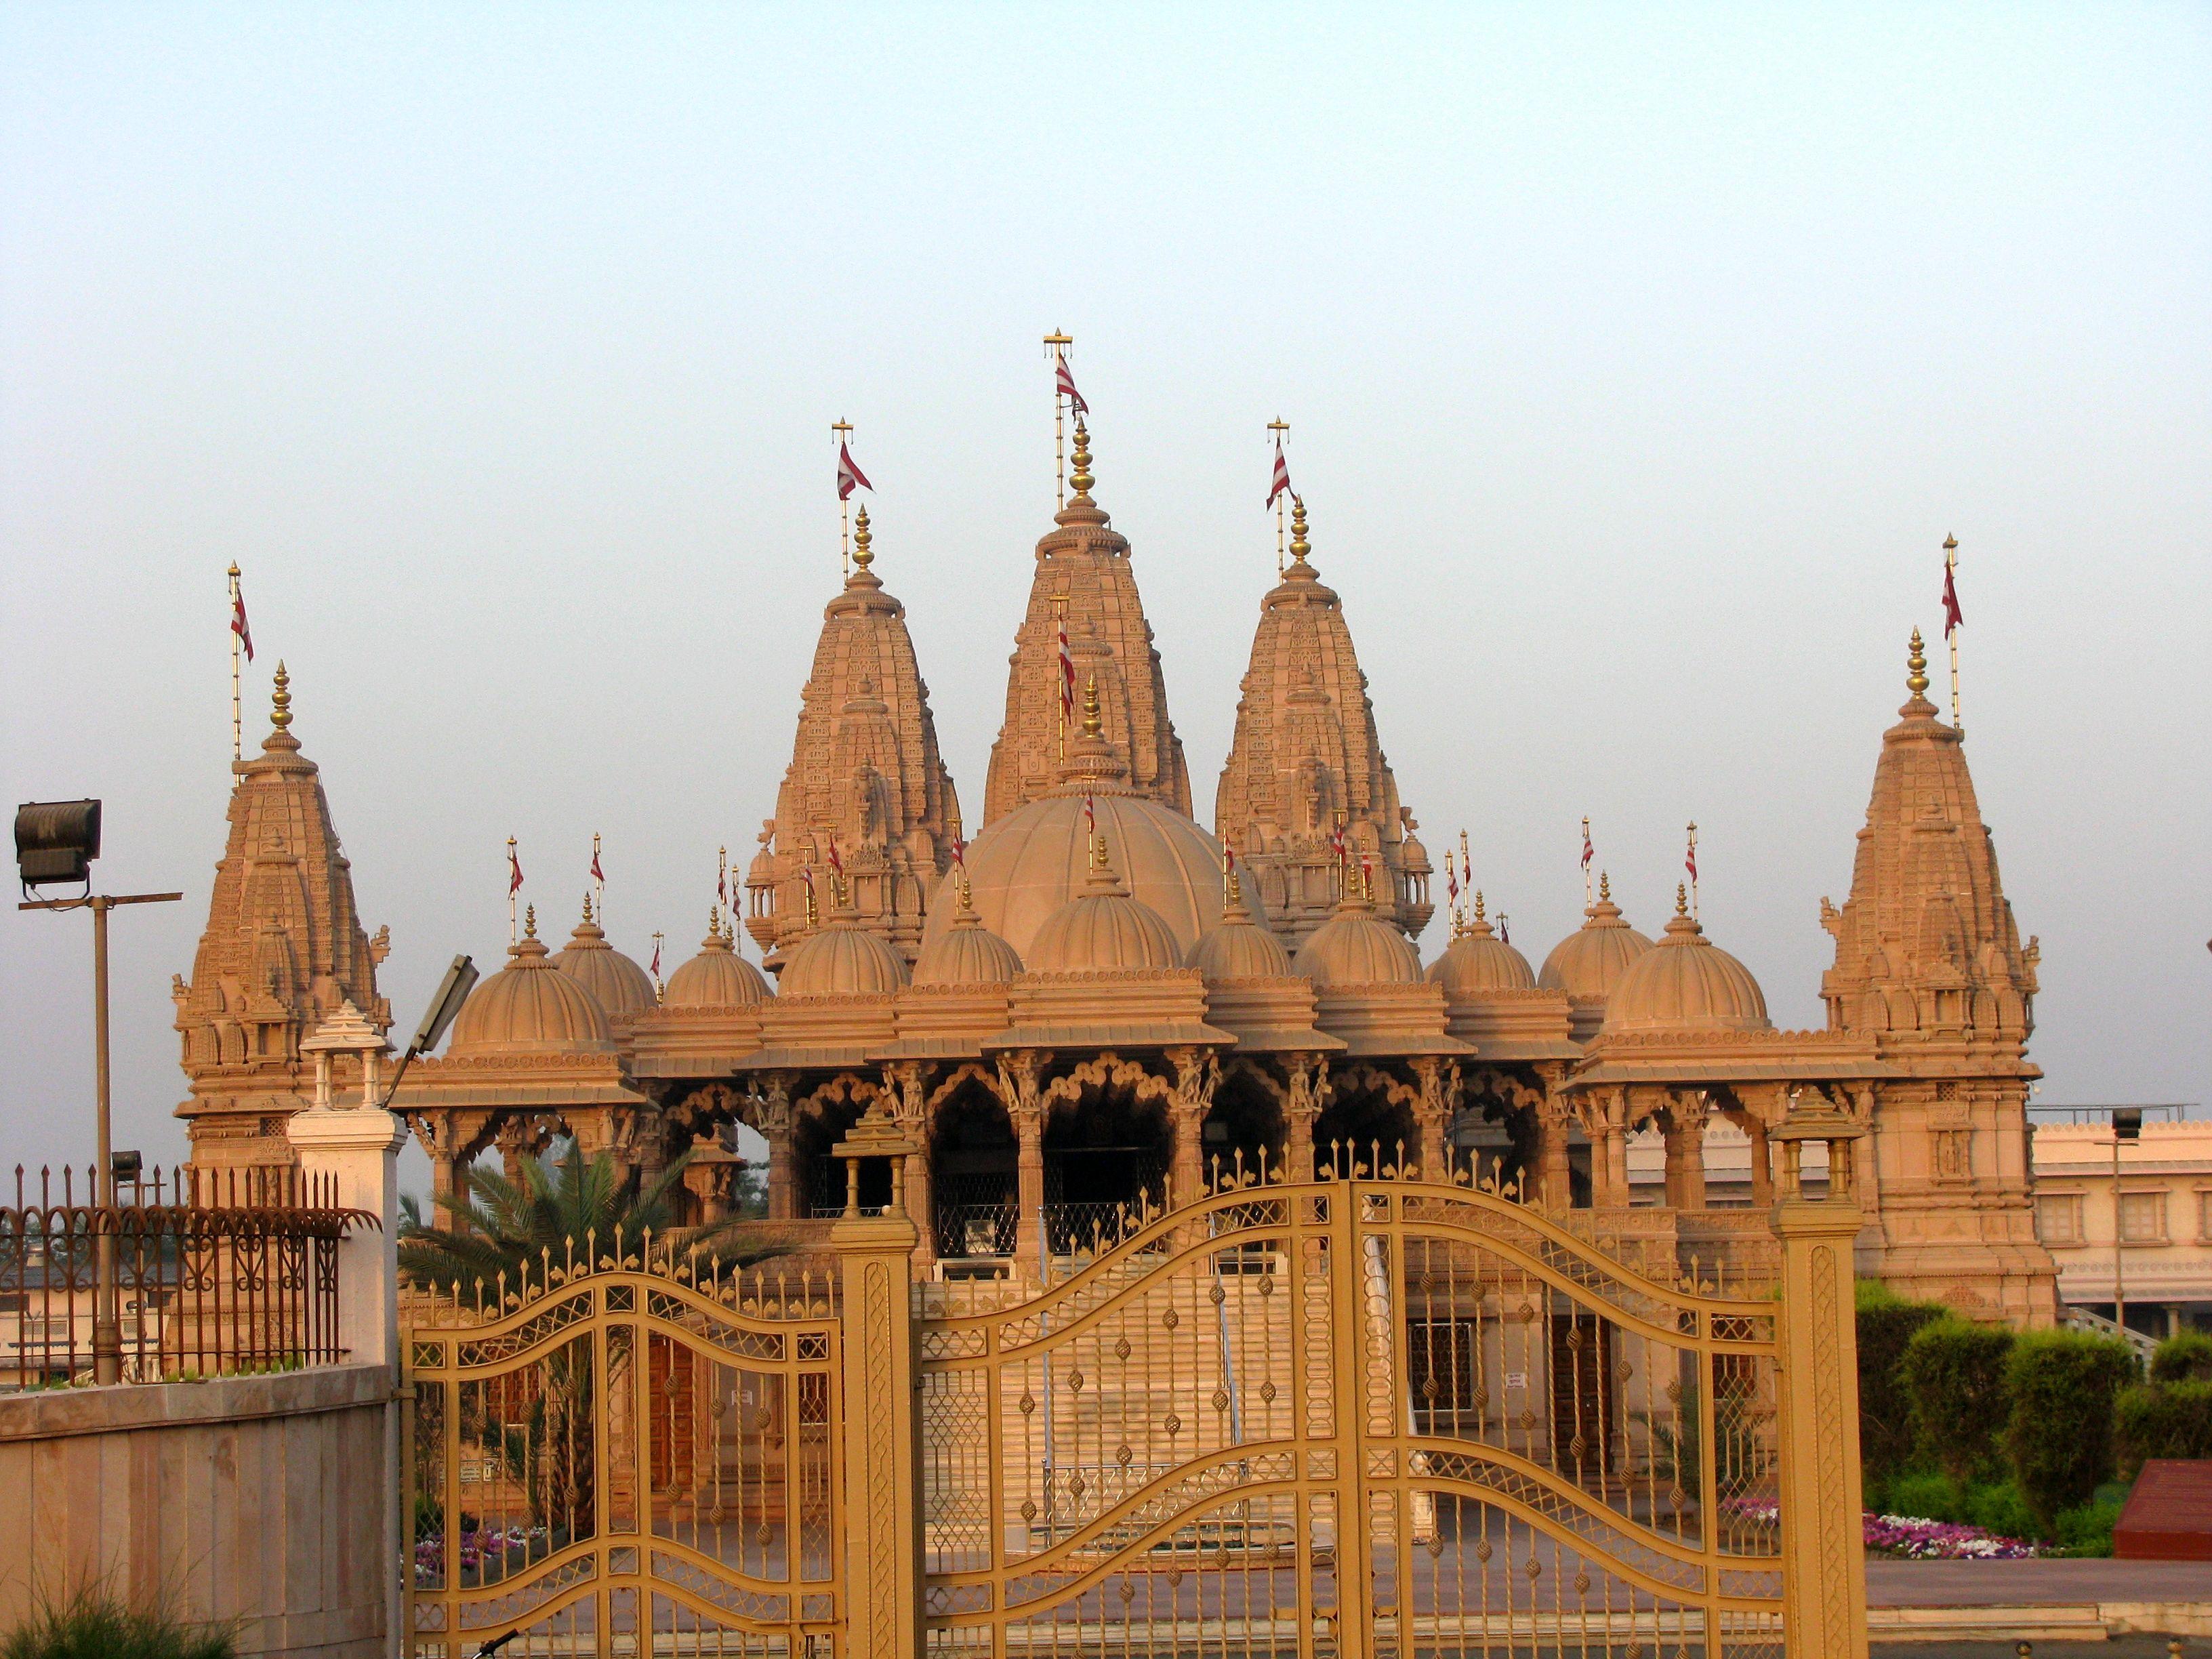
| Hindu temple | 102 |
| Shopping | 69 |
| Shopping other | 53 |
| Education | 48 |
| Grocery stores and supermarkets | 44 |
| Religion | 34 |
| Tractors and farm equipment | 33 |
| Restaurants | 32 |
| Clothing stores | 27 |
| Post office | 26 |
| Primary and elementary schools | 25 |
| Car repair | 24 |
| Public administration | 24 |
| Hospitals | 21 |
Sankheda Facts
| Area | 638.6 km² |
| Population | 234,113 |
| Male Population | 121,029 (51.7%) |
| Female Population | 113,084 (48.3%) |
| Population change (1975 to 2020) | +88.6% |
| Population change (2000 to 2020) | +20.5% |
| Median Age | 27.8 years (Male: 27.2, Female: 28.5) |
| Area Codes | 2665 |
| Neighborhoods | Kharadi Waga, Sutharwaga |
| Local Time | |
| Timezone | India Standard Time |
| Lat & Lng | 22.17021, 73.57820 |
| Pin Codes | 391125, 391130, 391145 |
Map of Sankheda
Interactive Map
Sankheda Population
Years 1975 to 2020
| Data | 1975 | 1990 | 2000 | 2015 | 2020 |
|---|---|---|---|---|---|
| Population | 124,144 | 166,118 | 194,211 | 219,151 | 234,113 |
| Population Density | 194.4 / km² | 260.1 / km² | 304.1 / km² | 343.2 / km² | 366.6 / km² |
Sankheda Population change from 2000 to 2015
Increase of 12.8% from year 2000 to 2015
| Location | Change since 1975 | Change since 1990 | Change since 2000 |
|---|---|---|---|
| Sankheda | +76.5% | +31.9% | +12.8% |
| Gujarat | +124.2% | +56.1% | +27.3% |
| India | +111.1% | +50.6% | +24.5% |
Sankheda Median Age
Median Age: 27.8 years
| Location | Median Age | Median Age (Female) | Median Age (Male) |
|---|---|---|---|
| Sankheda | 27.8 yrs | 28.5 yrs | 27.2 yrs |
| Gujarat | 25.9 yrs | 26.6 yrs | 25.4 yrs |
| India | 24.9 yrs | 25.4 yrs | 24.5 yrs |
Sankheda Population Density
Population Density: 367 / km²
| Location | Population | Area | Density |
|---|---|---|---|
| Sankheda | 234,113 | 638.6 km² | 367 / km² |
| Gujarat | 65.6 million | 185,787.8 km² | 353 / km² |
| India | 1,307 million | 3,083,563.4 km² | 424 / km² |
Sankheda Historical and Projected Population
Estimated Population from 0 to 2100
- JRC (European Commission's Joint Research Centre) work on the GHS built-up grid
- CIESIN (Center for International Earth Science Information Network)
- [Link] Klein Goldewijk, K., Beusen, A., Doelman, J., and Stehfest, E.: Anthropogenic land use estimates for the Holocene – HYDE 3.2, Earth Syst. Sci. Data, 9, 927–953, https://doi.org/10.5194/essd-9-927-2017, 2017.
Human Development Index (HDI)
Statistic composite index of life expectancy, education, and per capita income.
Sankheda CO2 Emissions
Carbon Dioxide (CO2) Emissions Per Capita in Tonnes Per Year
| Location | CO2 Emissions | CO2 Emissions Per Capita | CO2 Emissions Intensity |
|---|---|---|---|
| Sankheda | 533,027 tn | 2.28 tn | 834.6 tons/km² |
| Gujarat | 117,116,364 tn | 1.78 tn | 630.4 tons/km² |
| India | 1,928,568,344 tn | 1.48 tn | 625.4 tons/km² |
| 2013 CO2 emissions (tonnes/year) | 533,027 tn |
| 2013 CO2 emissions (tonnes/year) per capita | 2.28 tn |
| 2013 CO2 emissions intensity (tonnes/km²/year) | 834.6 tons/km² |
Natural Hazards Risk
Relative risk out of 10
| Hazard | Risk Level |
|---|---|
| Drought | Medium (7) |
| Flood | High (8) |
* Risk, particularly concerning flood or landslide, may not be for the entire area.
- Dilley, M., R.S. Chen, U. Deichmann, A.L. Lerner-Lam, M. Arnold, J. Agwe, P. Buys, O. Kjekstad, B. Lyon, and G. Yetman. 2005. Natural Disaster Hotspots: A Global Risk Analysis. Washington, D.C.: World Bank. https://doi.org/10.1596/0-8213-5930-4.
- Center for Hazards and Risk Research - CHRR - Columbia University, Center for International Earth Science Information Network - CIESIN - Columbia University, and International Research Institute for Climate and Society - IRI - Columbia University. 2005. Global Drought Hazard Frequency and Distribution. Palisades, NY: NASA Socioeconomic Data and Applications Center (SEDAC). https://doi.org/10.7927/H4VX0DFT.
- Center for Hazards and Risk Research - CHRR - Columbia University, Center for International Earth Science Information Network - CIESIN - Columbia University. 2005. Global Flood Hazard Frequency and Distribution. Palisades, NY: NASA Socioeconomic Data and Applications Center (SEDAC). https://doi.org/10.7927/H4668B3D.
Recent Nearby Earthquakes
Magnitude 3.0 and greater
| Date▼ | Time↕ | Magnitude↕ | Distance↕ | Depth↕ | Location↕ | Link |
|---|---|---|---|---|---|---|
| 11/17/96 | 6:12 PM | 4.2 | 95.2 km | 10,000 m | Gujarat, India | usgs.gov |
Sankheda
The town of Sankheda in Chhota Udaipur district is known for its lacquer work. The work is done on country wood which, being brown, gives darker shades. is known for its handcrafted furniture, which is made from teak wood. This furniture is exported..
Sankheda Wikipedia Page


About Our Data
The data on this page is estimated using a number of publicly available tools and resources. It is provided without warranty, and could contain inaccuracies. Use at your own risk.