Categories in Visavadar
Industries
Business Distribution by Industry in Visavadar
| Industry Description | Number of Establishments |
|---|---|
| Hindu temple | 299 |
| Tractors and farm equipment | 190 |
| Shopping | 143 |
| Travel and transportation | 80 |
| Education | 68 |
| Shopping other | 52 |
| Electronics stores | 45 |
Visavadar Facts
| Area | 798.6 km² |
| Population | 176,939 |
| Male Population | 90,739 (51.3%) |
| Female Population | 86,200 (48.7%) |
| Population change (1975 to 2020) | +86.2% |
| Population change (2000 to 2020) | +21.3% |
| Median Age | 26.4 years (Male: 25.9, Female: 27) |
| Area Codes | 2873 |
| Neighborhoods | GEB Colony, Nilkanth Society |
| Local Time | |
| Timezone | India Standard Time |
| Lat & Lng | 21.33954, 70.74966 |
| Pin Codes | 362130 |
Map of Visavadar
Interactive Map
Visavadar Population
Years 1975 to 2020
| Data | 1975 | 1990 | 2000 | 2015 | 2020 |
|---|---|---|---|---|---|
| Population | 95,012 | 126,476 | 145,854 | 167,125 | 176,939 |
| Population Density | 119 / km² | 158.4 / km² | 182.6 / km² | 209.3 / km² | 221.6 / km² |
Visavadar Population change from 2000 to 2015
Increase of 14.6% from year 2000 to 2015
| Location | Change since 1975 | Change since 1990 | Change since 2000 |
|---|---|---|---|
| Visavadar | +75.9% | +32.1% | +14.6% |
| Gujarat | +124.2% | +56.1% | +27.3% |
| India | +111.1% | +50.6% | +24.5% |
Visavadar Median Age
Median Age: 26.4 years
| Location | Median Age | Median Age (Female) | Median Age (Male) |
|---|---|---|---|
| Visavadar | 26.4 yrs | 27 yrs | 25.9 yrs |
| Gujarat | 25.9 yrs | 26.6 yrs | 25.4 yrs |
| India | 24.9 yrs | 25.4 yrs | 24.5 yrs |
Visavadar Population Density
Population Density: 222 / km²
| Location | Population | Area | Density |
|---|---|---|---|
| Visavadar | 176,939 | 798.6 km² | 222 / km² |
| Gujarat | 65.6 million | 185,787.8 km² | 353 / km² |
| India | 1,307 million | 3,083,563.4 km² | 424 / km² |
Visavadar Historical and Projected Population
Estimated Population from 0 to 2100
- JRC (European Commission's Joint Research Centre) work on the GHS built-up grid
- CIESIN (Center for International Earth Science Information Network)
- [Link] Klein Goldewijk, K., Beusen, A., Doelman, J., and Stehfest, E.: Anthropogenic land use estimates for the Holocene – HYDE 3.2, Earth Syst. Sci. Data, 9, 927–953, https://doi.org/10.5194/essd-9-927-2017, 2017.
Human Development Index (HDI)
Statistic composite index of life expectancy, education, and per capita income.
Visavadar CO2 Emissions
Carbon Dioxide (CO2) Emissions Per Capita in Tonnes Per Year
| Location | CO2 Emissions | CO2 Emissions Per Capita | CO2 Emissions Intensity |
|---|---|---|---|
| Visavadar | 326,525 tn | 1.85 tn | 408.9 tons/km² |
| Gujarat | 117,116,364 tn | 1.78 tn | 630.4 tons/km² |
| India | 1,928,568,344 tn | 1.48 tn | 625.4 tons/km² |
| 2013 CO2 emissions (tonnes/year) | 326,525 tn |
| 2013 CO2 emissions (tonnes/year) per capita | 1.85 tn |
| 2013 CO2 emissions intensity (tonnes/km²/year) | 408.9 tons/km² |
Natural Hazards Risk
Relative risk out of 10
| Hazard | Risk Level |
|---|---|
| Drought | High (10) |
| Flood | Medium (4) |
* Risk, particularly concerning flood or landslide, may not be for the entire area.
- Dilley, M., R.S. Chen, U. Deichmann, A.L. Lerner-Lam, M. Arnold, J. Agwe, P. Buys, O. Kjekstad, B. Lyon, and G. Yetman. 2005. Natural Disaster Hotspots: A Global Risk Analysis. Washington, D.C.: World Bank. https://doi.org/10.1596/0-8213-5930-4.
- Center for Hazards and Risk Research - CHRR - Columbia University, Center for International Earth Science Information Network - CIESIN - Columbia University, and International Research Institute for Climate and Society - IRI - Columbia University. 2005. Global Drought Hazard Frequency and Distribution. Palisades, NY: NASA Socioeconomic Data and Applications Center (SEDAC). https://doi.org/10.7927/H4VX0DFT.
- Center for Hazards and Risk Research - CHRR - Columbia University, Center for International Earth Science Information Network - CIESIN - Columbia University. 2005. Global Flood Hazard Frequency and Distribution. Palisades, NY: NASA Socioeconomic Data and Applications Center (SEDAC). https://doi.org/10.7927/H4668B3D.
Recent Nearby Earthquakes
Magnitude 3.0 and greater
| Date▼ | Time↕ | Magnitude↕ | Distance↕ | Depth↕ | Location↕ | Link |
|---|---|---|---|---|---|---|
| 7/17/16 | 3:54 AM | 4.1 | 83.8 km | 10,000 m | 12km SSW of Gariadhar, India | usgs.gov |
| 10/20/11 | 5:18 PM | 5.1 | 26.6 km | 10,000 m | Gujarat, India | usgs.gov |
| 10/5/08 | 11:33 AM | 3.8 | 28.5 km | 10,000 m | Gujarat, India | usgs.gov |
| 11/6/07 | 9:38 AM | 5.1 | 17.8 km | 10,000 m | Gujarat, India | usgs.gov |
| 11/6/07 | 12:27 AM | 4.9 | 19.7 km | 10,000 m | Gujarat, India | usgs.gov |
| 8/13/00 | 1:28 PM | 4.7 | 40.9 km | 14,300 m | Gujarat, India | usgs.gov |
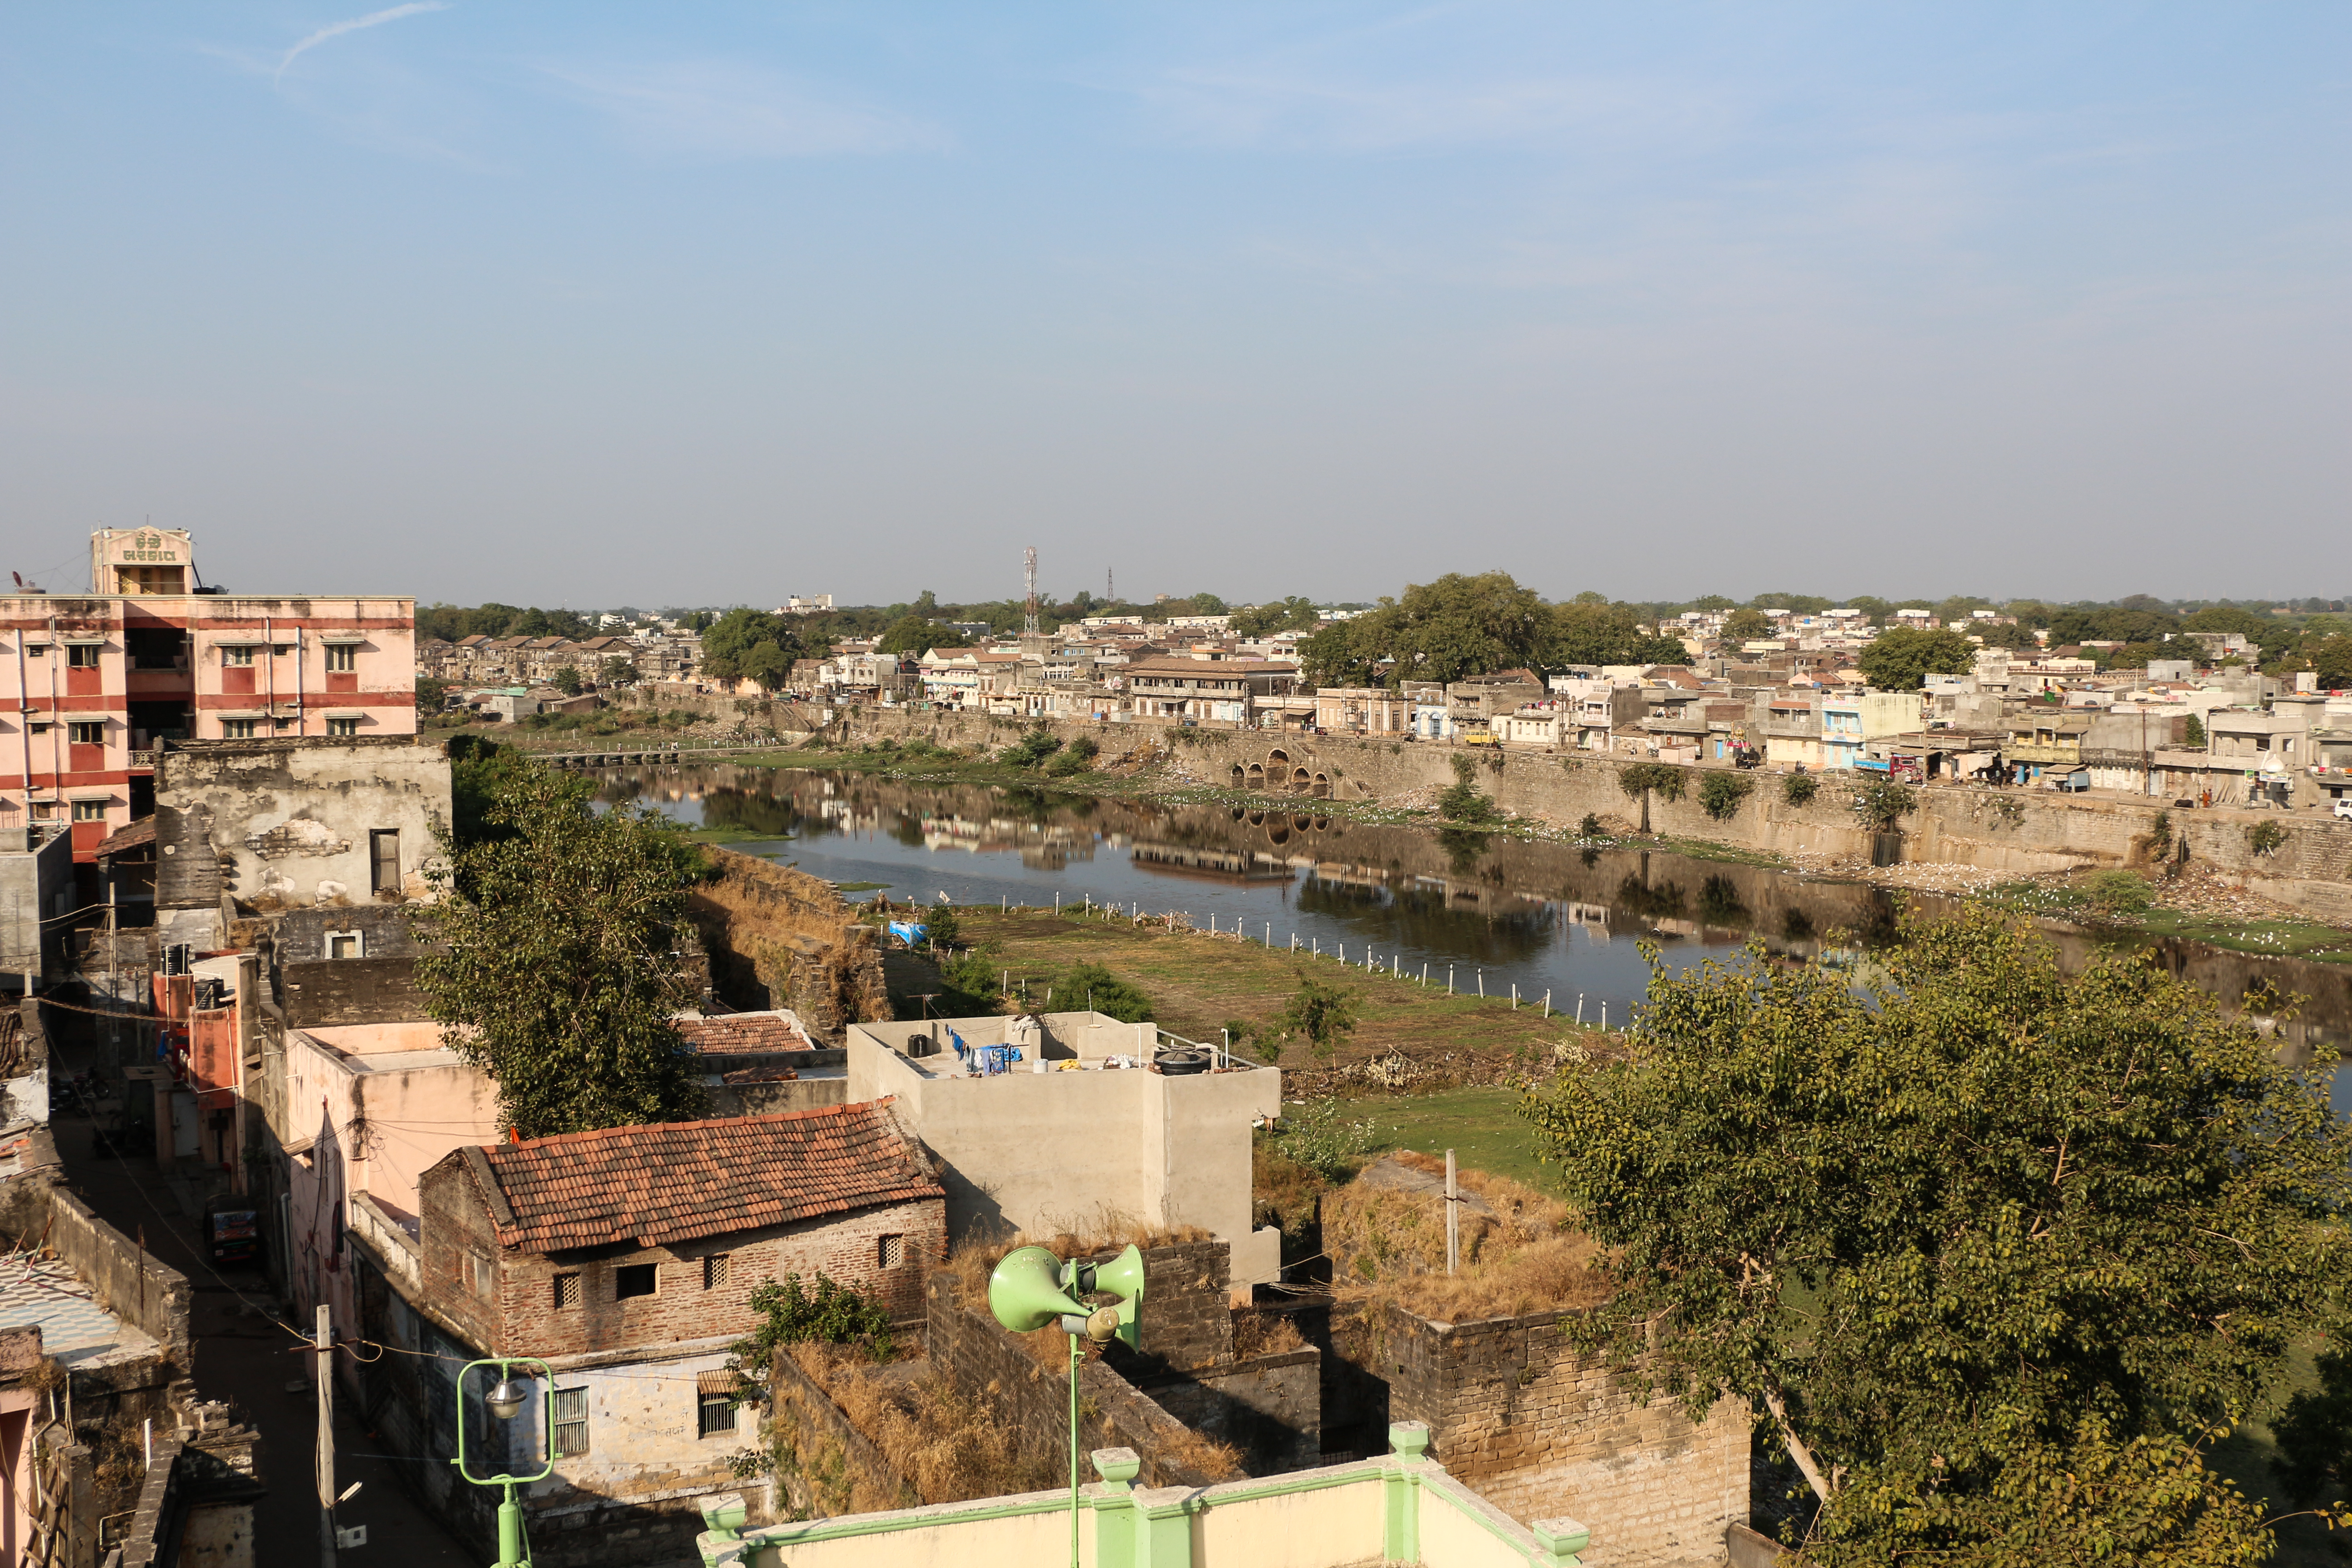
Visavadar
Visavadar (विसावदर) is a city and a municipality in Junagadh district in the Indian state of Gujarat.
Visavadar Wikipedia Page

About Our Data
The data on this page is estimated using a number of publicly available tools and resources. It is provided without warranty, and could contain inaccuracies. Use at your own risk.