Categories in Baghdad
Industries
Business Distribution by Industry in Baghdad
| Industry Description | Number of Establishments | Average Age of Business |
|---|---|---|
| Shopping | 7,796 | 18 years |
| Apartments | 5,819 | — |
| Restaurants | 4,386 | 11 years |
| Grocery stores and supermarkets | 4,316 | — |
| Education | 3,842 | 16 years |
| Electronics stores | 3,398 | 17 years |
| Cafes | 2,332 | — |
| Clothing stores | 2,150 | 17 years |
| Pharmacies and drug stores | 2,121 | — |
Baghdad Facts
| Area | 1315.9 km² |
| Population | 5,936,801 |
| Male Population | 3,006,942 (50.6%) |
| Female Population | 2,929,859 (49.4%) |
| Population change (1975 to 2020) | +132.4% |
| Population change (2000 to 2020) | +45.6% |
| Median Age | 19 years (Male: 18.7, Female: 19.4) |
| Area Codes | 1 |
| Neighborhoods | Mansour, Al-Wahda, Inner Karada, Sadr City, Karada |
| Local Time | |
| Timezone | Arabian Standard Time |
| Lat & Lng | 33.34058, 44.40088 |
| Postal Codes | 10001, 10003, 10005, 10006, 10011, More |
Map of Baghdad
Interactive Map
Baghdad Population
Years 1975 to 2020
| Data | 1975 | 1990 | 2000 | 2015 | 2020 |
|---|---|---|---|---|---|
| Population | 2,554,205 | 3,341,105 | 4,078,837 | 5,318,775 | 5,936,801 |
| Population Density | 1,941.1 / km² | 2,539.1 / km² | 3,099.7 / km² | 4,042 / km² | 4,511.7 / km² |
Baghdad Population change from 2000 to 2015
Increase of 30.4% from year 2000 to 2015
| Location | Change since 1975 | Change since 1990 | Change since 2000 |
|---|---|---|---|
| Baghdad | +108.2% | +59.2% | +30.4% |
| Baghdad Governorate | +108.3% | +59.2% | +30.4% |
| Iraq | +211.5% | +108.2% | +54.4% |
Baghdad Median Age
Median Age: 19 years
| Location | Median Age | Median Age (Female) | Median Age (Male) |
|---|---|---|---|
| Baghdad | 19 yrs | 19.4 yrs | 18.7 yrs |
| Baghdad Governorate | 19 yrs | 19.4 yrs | 18.7 yrs |
| Iraq | 19 yrs | 19.4 yrs | 18.7 yrs |
Baghdad Population Density
Population Density: 4,512 / km²
| Location | Population | Area | Density |
|---|---|---|---|
| Baghdad | 5.9 million | 1,315.9 km² | 4,512 / km² |
| Baghdad Governorate | 7.2 million | 5,185.2 km² | 1,395 / km² |
| Iraq | 36.4 million | 437,126.8 km² | 83.3 / km² |
Baghdad Historical and Projected Population
Estimated Population from 1890 to 2100
- JRC (European Commission's Joint Research Centre) work on the GHS built-up grid
- CIESIN (Center for International Earth Science Information Network)
- [Link] Klein Goldewijk, K., Beusen, A., Doelman, J., and Stehfest, E.: Anthropogenic land use estimates for the Holocene – HYDE 3.2, Earth Syst. Sci. Data, 9, 927–953, https://doi.org/10.5194/essd-9-927-2017, 2017.
Neighborhoods in Baghdad
Percentage of businesses by neighborhood in Baghdad
Area Codes
Percentage Area Codes used by businesses in Baghdad
Price Distribution
Business distribution by price for Baghdad
Human Development Index (HDI)
Statistic composite index of life expectancy, education, and per capita income.
Baghdad CO2 Emissions
Carbon Dioxide (CO2) Emissions Per Capita in Tonnes Per Year
| Location | CO2 Emissions | CO2 Emissions Per Capita | CO2 Emissions Intensity |
|---|---|---|---|
| Baghdad | 21,922,267 tn | 3.69 tn | 16,659.8 tons/km² |
| Baghdad Governorate | 26,731,960 tn | 3.7 tn | 5,155.5 tons/km² |
| Iraq | 134,886,662 tn | 3.71 tn | 308.6 tons/km² |
| 2013 CO2 emissions (tonnes/year) | 21,922,267 tn |
| 2013 CO2 emissions (tonnes/year) per capita | 3.69 tn |
| 2013 CO2 emissions intensity (tonnes/km²/year) | 16,659.8 tons/km² |
Natural Hazards Risk
Relative risk out of 10
| Hazard | Risk Level |
|---|---|
| Drought | Medium (7) |
* Risk, particularly concerning flood or landslide, may not be for the entire area.
- Dilley, M., R.S. Chen, U. Deichmann, A.L. Lerner-Lam, M. Arnold, J. Agwe, P. Buys, O. Kjekstad, B. Lyon, and G. Yetman. 2005. Natural Disaster Hotspots: A Global Risk Analysis. Washington, D.C.: World Bank. https://doi.org/10.1596/0-8213-5930-4.
- Center for Hazards and Risk Research - CHRR - Columbia University, Center for International Earth Science Information Network - CIESIN - Columbia University, and International Research Institute for Climate and Society - IRI - Columbia University. 2005. Global Drought Hazard Frequency and Distribution. Palisades, NY: NASA Socioeconomic Data and Applications Center (SEDAC). https://doi.org/10.7927/H4VX0DFT.
Recent Nearby Earthquakes
Magnitude 3.0 and greater
| Date▼ | Time↕ | Magnitude↕ | Distance↕ | Depth↕ | Location↕ | Link |
|---|---|---|---|---|---|---|
| 2/24/18 | 4:26 PM | 4 | 91.7 km | 10,000 m | 26km ESE of Al Miqdadiyah, Iraq | usgs.gov |
| 1/11/18 | 1:16 PM | 4.4 | 96.3 km | 10,000 m | 42km SSW of Mandali, Iraq | usgs.gov |
| 12/19/17 | 3:13 PM | 4.3 | 90.4 km | 10,000 m | 12km ESE of Al Miqdadiyah, Iraq | usgs.gov |
| 2/20/90 | 5:55 AM | 4.6 | 85 km | 37,600 m | Iraq | usgs.gov |
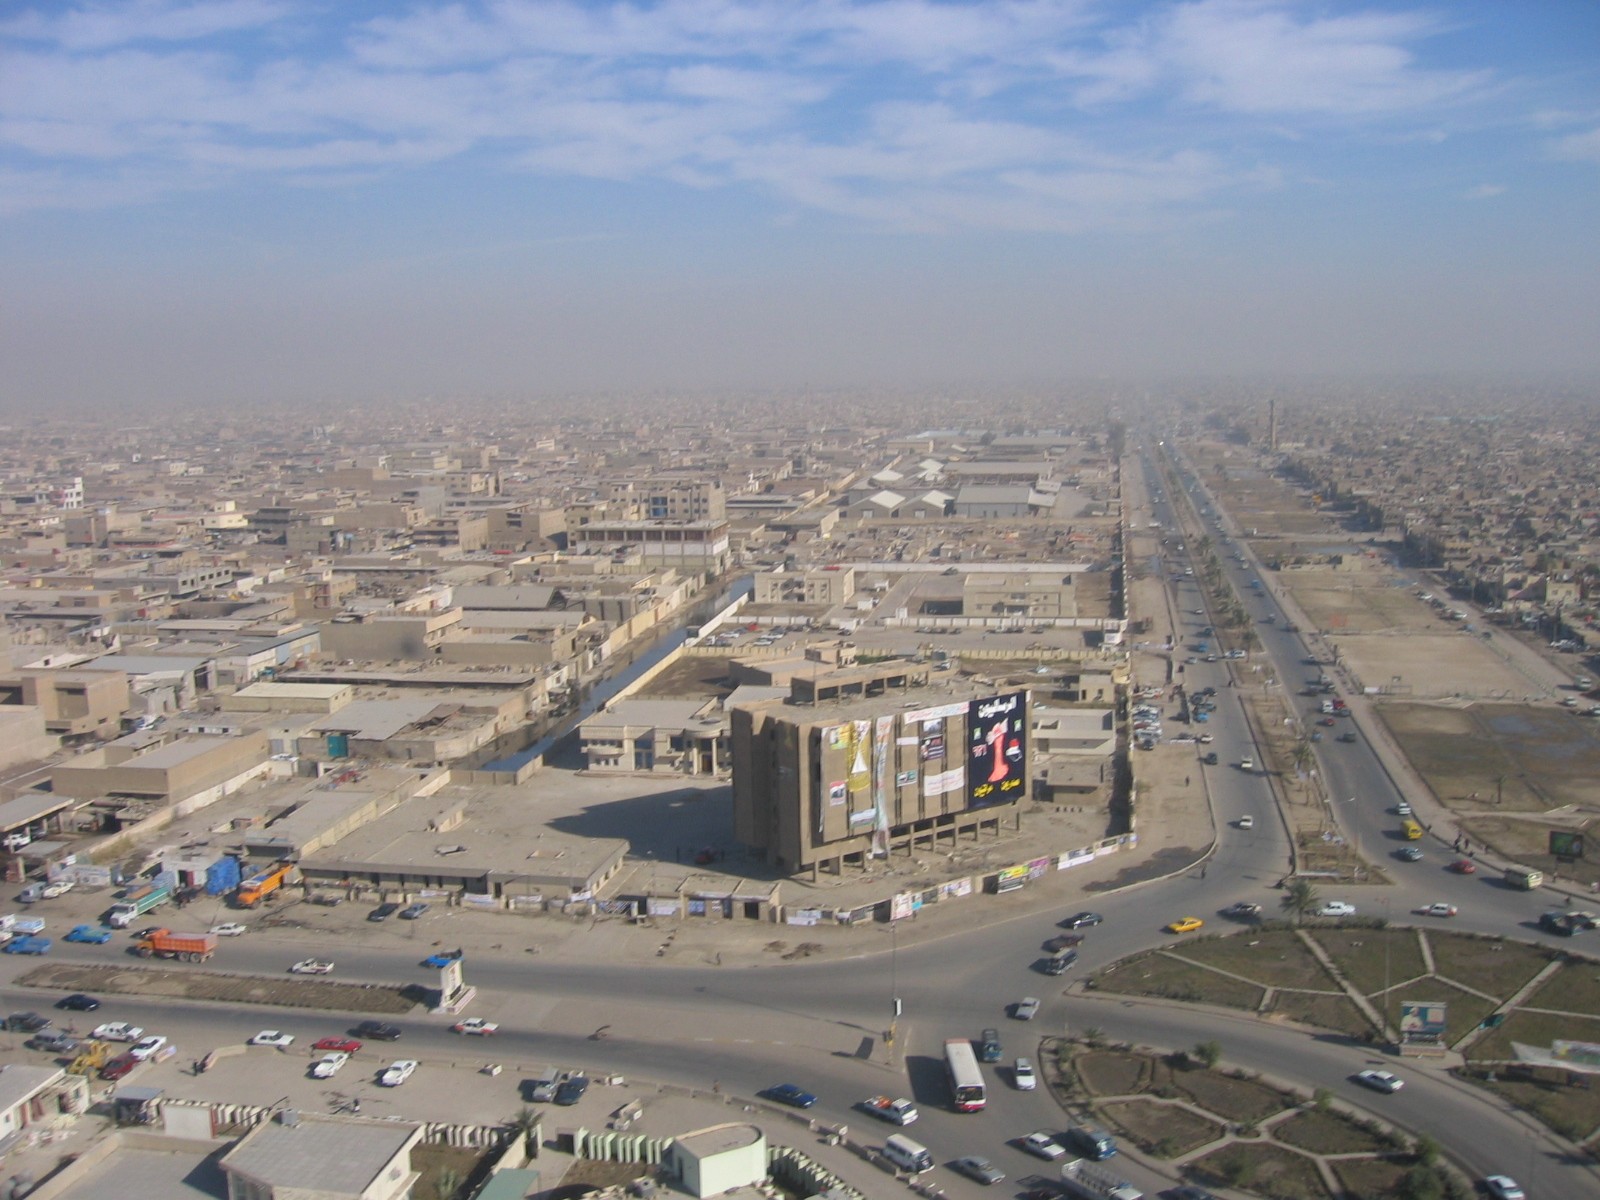
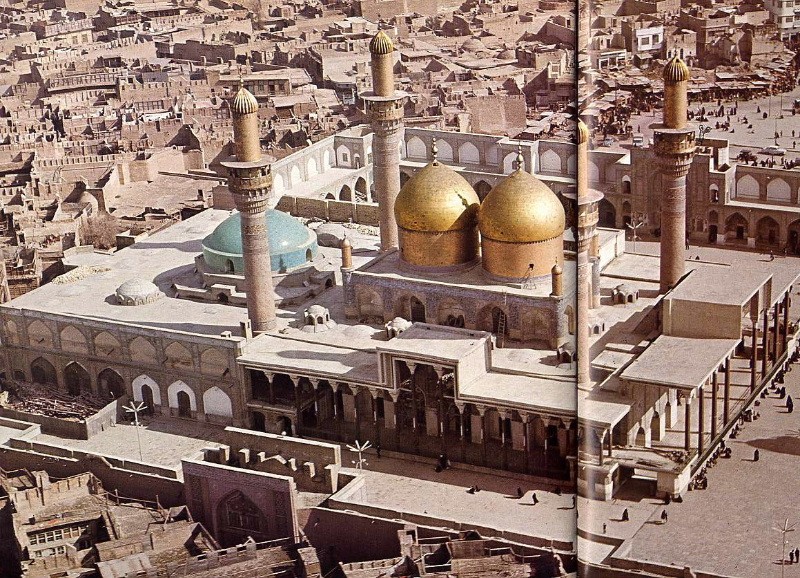
Baghdad
Baghdad (Arabic: بغداد ,بغداد Kurdish: Bexda, Iraqi pronunciation: [bɐʁˈd̪ɑːd̪]) is the capital of the Republic of Iraq. The population of Baghdad, as of 2011, is approximately 7,216,040, making it the largest city in Iraq, the second largest city ..
Baghdad Wikipedia Page

About Our Data
The data on this page is estimated using a number of publicly available tools and resources. It is provided without warranty, and could contain inaccuracies. Use at your own risk.