Categories in Andria
Industries
Business Distribution by Industry in Andria
| Industry Description | Number of Establishments | Average Age of Business |
|---|---|---|
| Shopping | 599 | 30 years |
| Clothing stores | 404 | — |
| Grocery stores and supermarkets | 342 | — |
| Corporate management | 268 | — |
| Restaurants | 215 | — |
| Bars, pubs and taverns | 190 | — |
| All food and beverage | 173 | — |
| Car repair | 163 | — |
| Lawyers legal | 153 | — |
| Construction of buildings | 136 | — |
| Beauty salons | 134 | — |
| Shopping other | 128 | — |
| Technical construction services | 124 | — |
| Electronics stores | 119 | 25 years |
| Women's clothing | 115 | — |
| Freight/commercial transport | 113 | — |
Andria Facts
| Area | 16.2 km² |
| Population | 99,480 |
| Male Population | 49,537 (49.8%) |
| Female Population | 49,943 (50.2%) |
| Population change (1975 to 2020) | +14.1% |
| Population change (2000 to 2020) | +6.4% |
| Median Age | 36.6 years (Male: 36, Female: 37.1) |
| Area Codes | 883 |
| Neighborhoods | Murat, Libertà, San Nicola, Montegrosso, Poggiofranco |
| Local Time | |
| Timezone | Central European Summer Time |
| Lat & Lng | 41.23117, 16.29797 |
| Postal Codes | 70031 |
Map of Andria
Interactive Map
Andria Population
Years 1975 to 2020
| Data | 1975 | 1990 | 2000 | 2015 | 2020 |
|---|---|---|---|---|---|
| Population | 87,177 | 92,400 | 93,491 | 98,049 | 99,480 |
| Population Density | 5,385.5 / km² | 5,708.1 / km² | 5,775.5 / km² | 6,057.1 / km² | 6,145.5 / km² |
Andria Population change from 2000 to 2015
Increase of 4.9% from year 2000 to 2015
| Location | Change since 1975 | Change since 1990 | Change since 2000 |
|---|---|---|---|
| Andria | +12.5% | +6.1% | +4.9% |
| Italy | +8.3% | +4.9% | +4.7% |
Andria Median Age
Median Age: 36.6 years
| Location | Median Age | Median Age (Female) | Median Age (Male) |
|---|---|---|---|
| Andria | 36.6 yrs | 37.1 yrs | 36 yrs |
| Italy | 40.9 yrs | 41.5 yrs | 40.3 yrs |
Andria Population Density
Population Density: 6,146 / km²
| Location | Population | Area | Density |
|---|---|---|---|
| Andria | 99,480 | 16.2 km² | 6,146 / km² |
| Italy | 59.3 million | 301,510.7 km² | 197 / km² |
Andria Historical and Projected Population
Estimated Population from 0 to 2100
- JRC (European Commission's Joint Research Centre) work on the GHS built-up grid
- CIESIN (Center for International Earth Science Information Network)
- [Link] Klein Goldewijk, K., Beusen, A., Doelman, J., and Stehfest, E.: Anthropogenic land use estimates for the Holocene – HYDE 3.2, Earth Syst. Sci. Data, 9, 927–953, https://doi.org/10.5194/essd-9-927-2017, 2017.
Area Codes
Percentage Area Codes used by businesses in Andria
Postal Codes
Percentage of businesses by Postal Codes in Andria
Price Distribution
Business distribution by price for Andria
Human Development Index (HDI)
Statistic composite index of life expectancy, education, and per capita income.
Andria CO2 Emissions
Carbon Dioxide (CO2) Emissions Per Capita in Tonnes Per Year
| Location | CO2 Emissions | CO2 Emissions Per Capita | CO2 Emissions Intensity |
|---|---|---|---|
| Andria | 511,547 tn | 5.14 tn | 31,601.3 tons/km² |
| Italy | 399,008,505 tn | 6.73 tn | 1,323.4 tons/km² |
| 2013 CO2 emissions (tonnes/year) | 511,547 tn |
| 2013 CO2 emissions (tonnes/year) per capita | 5.14 tn |
| 2013 CO2 emissions intensity (tonnes/km²/year) | 31,601.3 tons/km² |
Natural Hazards Risk
Relative risk out of 10
| Hazard | Risk Level |
|---|---|
| Earthquake | Medium (4) |
* Risk, particularly concerning flood or landslide, may not be for the entire area.
- Dilley, M., R.S. Chen, U. Deichmann, A.L. Lerner-Lam, M. Arnold, J. Agwe, P. Buys, O. Kjekstad, B. Lyon, and G. Yetman. 2005. Natural Disaster Hotspots: A Global Risk Analysis. Washington, D.C.: World Bank. https://doi.org/10.1596/0-8213-5930-4.
- Center for Hazards and Risk Research - CHRR - Columbia University, Center for International Earth Science Information Network - CIESIN - Columbia University. 2005. Global Earthquake Hazard Distribution - Peak Ground Acceleration. Palisades, NY: NASA Socioeconomic Data and Applications Center (SEDAC). https://doi.org/10.7927/H4BZ63ZS.
Recent Nearby Earthquakes
Magnitude 3.0 and greater
| Date▼ | Time↕ | Magnitude↕ | Distance↕ | Depth↕ | Location↕ | Link |
|---|---|---|---|---|---|---|
| 8/12/12 | 1:21 AM | 4.1 | 60 km | 8,400 m | southern Italy | usgs.gov |
| 4/12/11 | 3:32 AM | 3.9 | 50.3 km | 10,100 m | southern Italy | usgs.gov |
| 9/17/10 | 12:20 PM | 4.4 | 62.9 km | 30,100 m | southern Italy | usgs.gov |
| 3/19/08 | 2:38 PM | 4.3 | 82.7 km | 31,600 m | southern Italy | usgs.gov |
| 1/19/08 | 3:11 PM | 3.2 | 59.4 km | 24,300 m | southern Italy | usgs.gov |
| 6/2/07 | 12:38 PM | 3 | 60 km | 24,700 m | southern Italy | usgs.gov |
| 2/25/07 | 2:58 PM | 3.1 | 70.8 km | 26,400 m | southern Italy | usgs.gov |
| 2/9/07 | 6:24 PM | 3 | 70.3 km | 32,299 m | southern Italy | usgs.gov |
| 12/10/06 | 11:03 AM | 4.6 | 79.1 km | 35,400 m | southern Italy | usgs.gov |
| 10/9/06 | 11:36 AM | 3 | 69.8 km | 27,500 m | southern Italy | usgs.gov |
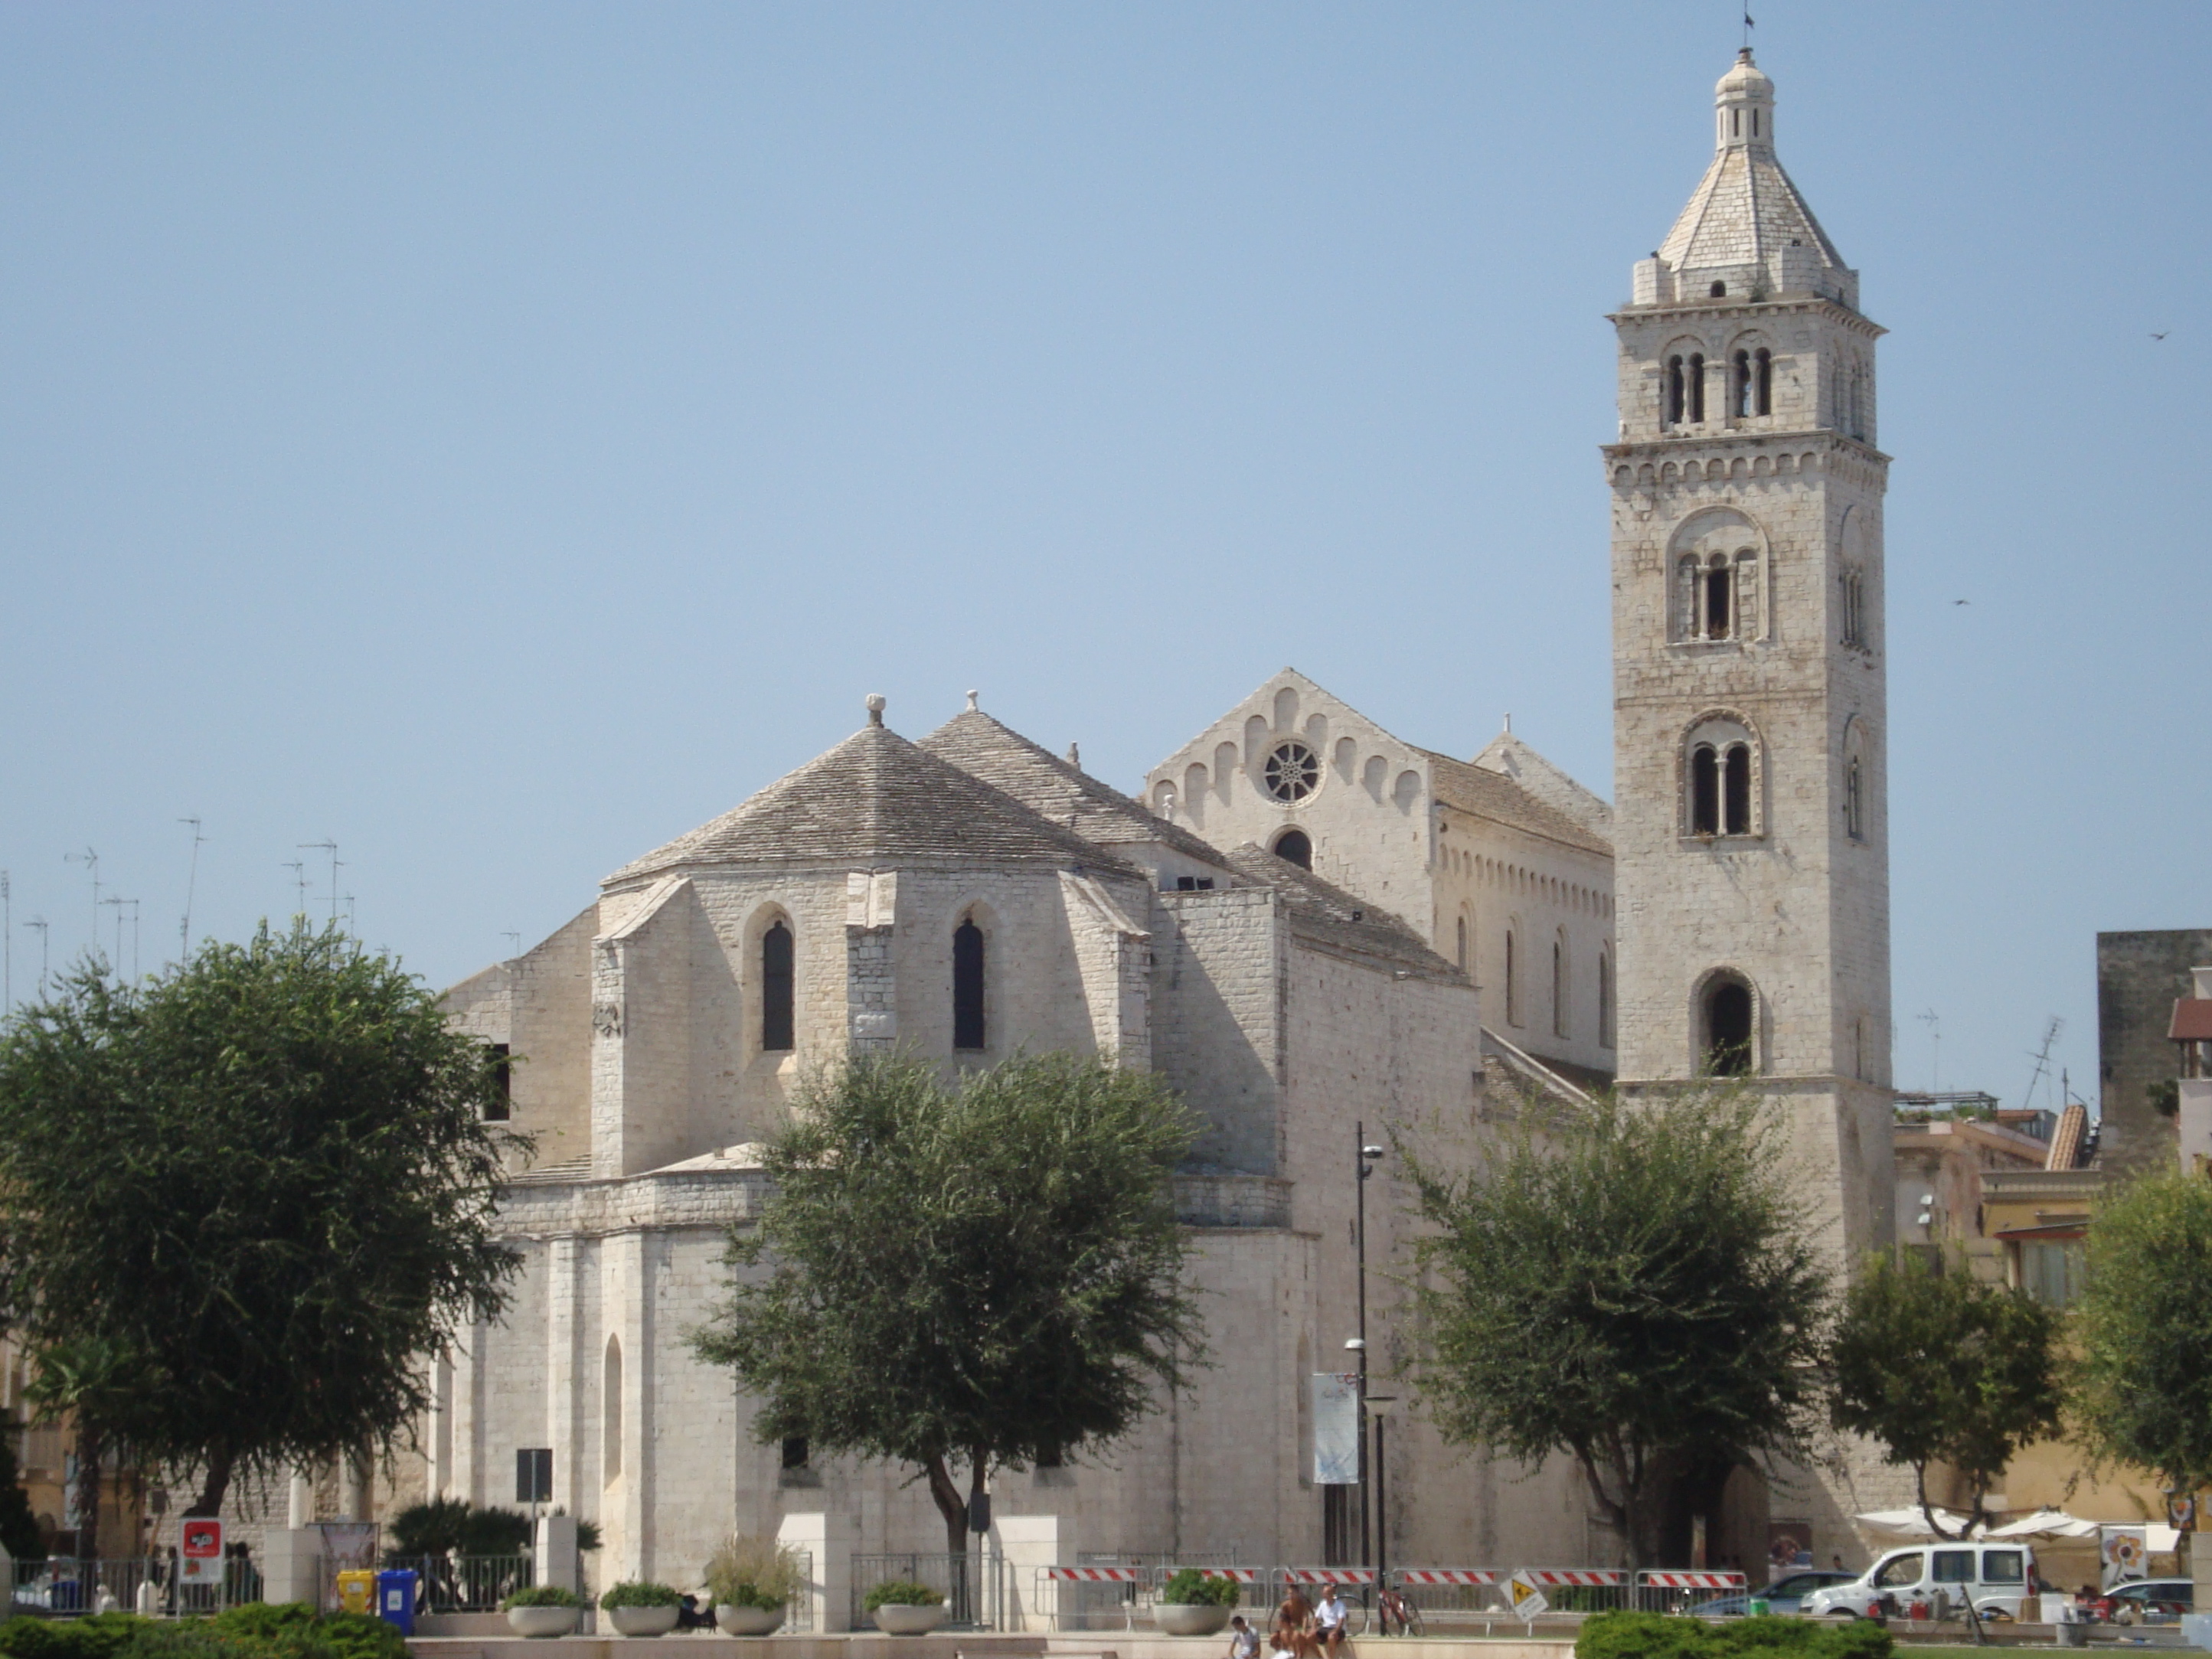
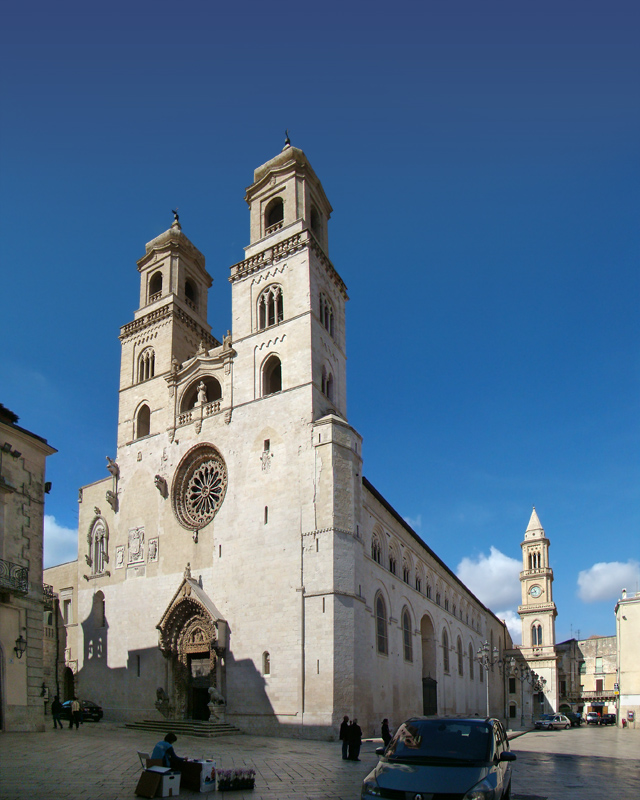
Andria
Andria [ˈandrja] listen is a city and comune in Apulia (southern Italy). It is an agricultural and service center, producing wine, olives and almonds. It is the fourth-largest municipality in the Apulia region (behind Bari, Taranto, and Foggia) and..
Andria Wikipedia Page

About Our Data
The data on this page is estimated using a number of publicly available tools and resources. It is provided without warranty, and could contain inaccuracies. Use at your own risk.