Categories in Formia
Industries
Business Distribution by Industry in Formia
| Industry Description | Number of Establishments |
|---|---|
| Shopping | 257 |
| Other accommodation | 143 |
| Restaurants | 140 |
| Grocery stores and supermarkets | 137 |
| Clothing stores | 130 |
| Lawyers legal | 129 |
| Bars, pubs and taverns | 127 |
| Corporate management | 108 |
| Real estate | 82 |
| Health and medical | 77 |
| Dentists | 63 |
| Beauty salons | 62 |
| Electronics stores | 61 |
| Travel agencies | 56 |
| Car repair | 56 |
| Bed and breakfasts | 55 |
Formia Facts
| Area | 5.8 km² |
| Population | 23,139 |
| Male Population | 11,096 (48.0%) |
| Female Population | 12,043 (52.0%) |
| Population change (1975 to 2020) | +9.7% |
| Population change (2000 to 2020) | +3.4% |
| Median Age | 41.6 years (Male: 40.8, Female: 42.3) |
| Area Codes | 771 |
| Neighborhoods | Gianola, Santa Croce |
| Local Time | |
| Timezone | Central European Summer Time |
| Lat & Lng | 41.25632, 13.60888 |
Map of Formia
Interactive Map
Formia Population
Years 1975 to 2020
| Data | 1975 | 1990 | 2000 | 2015 | 2020 |
|---|---|---|---|---|---|
| Population | 21,092 | 22,185 | 22,368 | 23,249 | 23,139 |
| Population Density | 3,628.7 / km² | 3,816.8 / km² | 3,848.3 / km² | 3,999.8 / km² | 3,980.9 / km² |
Formia Population change from 2000 to 2015
Increase of 3.9% from year 2000 to 2015
| Location | Change since 1975 | Change since 1990 | Change since 2000 |
|---|---|---|---|
| Formia | +10.2% | +4.8% | +3.9% |
| Italy | +8.3% | +4.9% | +4.7% |
Formia Median Age
Median Age: 41.6 years
| Location | Median Age | Median Age (Female) | Median Age (Male) |
|---|---|---|---|
| Formia | 41.6 yrs | 42.3 yrs | 40.8 yrs |
| Italy | 40.9 yrs | 41.5 yrs | 40.3 yrs |
Formia Population Density
Population Density: 3,981 / km²
| Location | Population | Area | Density |
|---|---|---|---|
| Formia | 23,139 | 5.8 km² | 3,981 / km² |
| Italy | 59.3 million | 301,510.7 km² | 197 / km² |
Formia Historical and Projected Population
Estimated Population from 0 to 2100
- JRC (European Commission's Joint Research Centre) work on the GHS built-up grid
- CIESIN (Center for International Earth Science Information Network)
- [Link] Klein Goldewijk, K., Beusen, A., Doelman, J., and Stehfest, E.: Anthropogenic land use estimates for the Holocene – HYDE 3.2, Earth Syst. Sci. Data, 9, 927–953, https://doi.org/10.5194/essd-9-927-2017, 2017.
Area Codes
Percentage Area Codes used by businesses in Formia
Price Distribution
Business distribution by price for Formia
Human Development Index (HDI)
Statistic composite index of life expectancy, education, and per capita income.
Formia CO2 Emissions
Carbon Dioxide (CO2) Emissions Per Capita in Tonnes Per Year
| Location | CO2 Emissions | CO2 Emissions Per Capita | CO2 Emissions Intensity |
|---|---|---|---|
| Formia | 98,992 tn | 4.28 tn | 17,030.8 tons/km² |
| Italy | 399,008,505 tn | 6.73 tn | 1,323.4 tons/km² |
| 2013 CO2 emissions (tonnes/year) | 98,992 tn |
| 2013 CO2 emissions (tonnes/year) per capita | 4.28 tn |
| 2013 CO2 emissions intensity (tonnes/km²/year) | 17,030.8 tons/km² |
Natural Hazards Risk
Relative risk out of 10
| Hazard | Risk Level |
|---|---|
| Earthquake | Medium (4) |
| Landslide | Medium (6) |
* Risk, particularly concerning flood or landslide, may not be for the entire area.
- Dilley, M., R.S. Chen, U. Deichmann, A.L. Lerner-Lam, M. Arnold, J. Agwe, P. Buys, O. Kjekstad, B. Lyon, and G. Yetman. 2005. Natural Disaster Hotspots: A Global Risk Analysis. Washington, D.C.: World Bank. https://doi.org/10.1596/0-8213-5930-4.
- Center for Hazards and Risk Research - CHRR - Columbia University, Center for International Earth Science Information Network - CIESIN - Columbia University, and Norwegian Geotechnical Institute - NGI. 2005. Global Landslide Hazard Distribution. Palisades, NY: NASA Socioeconomic Data and Applications Center (SEDAC). https://doi.org/10.7927/H4P848VZ.
- Center for Hazards and Risk Research - CHRR - Columbia University, Center for International Earth Science Information Network - CIESIN - Columbia University. 2005. Global Earthquake Hazard Distribution - Peak Ground Acceleration. Palisades, NY: NASA Socioeconomic Data and Applications Center (SEDAC). https://doi.org/10.7927/H4BZ63ZS.
Recent Nearby Earthquakes
Magnitude 3.0 and greater
| Date▼ | Time↕ | Magnitude↕ | Distance↕ | Depth↕ | Location↕ | Link |
|---|---|---|---|---|---|---|
| 1/1/19 | 6:37 PM | 4.3 | 74.3 km | 16,110 m | 4km SSW of Trasacco, Italy | usgs.gov |
| 8/21/17 | 6:57 PM | 4.2 | 59.4 km | 2,650 m | 4km NNE of Casamicciola Terme, Italy | usgs.gov |
| 2/28/15 | 3:16 AM | 4.2 | 80.5 km | 17,300 m | 2km N of Trasacco, Italy | usgs.gov |
| 1/1/15 | 7:48 PM | 4.2 | 66.2 km | 318,140 m | 2km WNW of Roccamandolfi, Italy | usgs.gov |
| 2/16/13 | 9:16 PM | 4.8 | 50.9 km | 10,700 m | 3km SSE of Balsorano Vecchio, Italy | usgs.gov |
| 7/12/12 | 9:23 PM | 4 | 73.1 km | 423,000 m | Tyrrhenian Sea | usgs.gov |
| 8/6/09 | 3:36 PM | 4.2 | 42 km | 11,100 m | southern Italy | usgs.gov |
| 10/11/08 | 12:58 PM | 3.3 | 86.4 km | 13,800 m | southern Italy | usgs.gov |
| 2/20/08 | 8:06 AM | 4.6 | 38.9 km | 8,500 m | southern Italy | usgs.gov |
| 2/6/08 | 6:34 PM | 3.1 | 29.4 km | 10,000 m | southern Italy | usgs.gov |
Formia
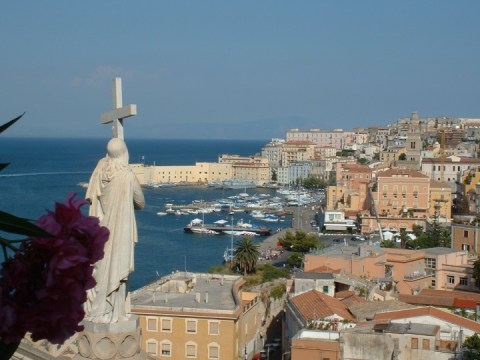
Formia is a city and comune in the province of Latina, on the Mediterranean coast of Lazio (Italy). It is located halfway between Rome and Naples, and lies on the Roman-era Appian Way.
Formia Wikipedia Page


About Our Data
The data on this page is estimated using a number of publicly available tools and resources. It is provided without warranty, and could contain inaccuracies. Use at your own risk.