Categories in Prato
Industries
Business Distribution by Industry in Prato
| Industry Description | Number of Establishments | Average Age of Business |
|---|---|---|
| Shopping | 1,924 | 26 years |
| Clothing stores | 1,623 | 33 years |
| Corporate management | 1,246 | 28 years |
| Wholesale of clothing and textiles | 801 | — |
| Restaurants | 723 | 26 years |
| Retail of textiles | 713 | 32 years |
| Real estate | 663 | — |
| Scientific and technical services | 644 | — |
| Lawyers legal | 555 | — |
| Bars, pubs and taverns | 537 | — |
| Construction of buildings | 441 | — |
| Car repair | 427 | — |
| Grocery stores and supermarkets | 424 | — |
| Beauty salons | 406 | — |
| Hairdressers | 339 | — |
Prato Facts
| Area | 108.8 km² |
| Population | 192,983 |
| Male Population | 95,188 (49.3%) |
| Female Population | 97,795 (50.7%) |
| Population change (1975 to 2020) | +28.7% |
| Population change (2000 to 2020) | +11.8% |
| Median Age | 40.6 years (Male: 39.9, Female: 41.4) |
| Area Codes | 574 |
| Neighborhoods | San Giusto, centro, La Querce, centro storico, Mercato Centrale |
| Local Time | |
| Timezone | Central European Summer Time |
| Lat & Lng | 43.87309, 11.08278 |
| Postal Codes | 59021, 59026, 59100 |
Map of Prato
Interactive Map
Prato Population
Years 1975 to 2020
| Data | 1975 | 1990 | 2000 | 2015 | 2020 |
|---|---|---|---|---|---|
| Population | 149,974 | 165,772 | 172,666 | 188,915 | 192,983 |
| Population Density | 1,378.3 / km² | 1,523.5 / km² | 1,586.8 / km² | 1,736.2 / km² | 1,773.5 / km² |
Prato Population change from 2000 to 2015
Increase of 9.4% from year 2000 to 2015
| Location | Change since 1975 | Change since 1990 | Change since 2000 |
|---|---|---|---|
| Prato | +26% | +14% | +9.4% |
| Italy | +8.3% | +4.9% | +4.7% |
Prato Median Age
Median Age: 40.6 years
| Location | Median Age | Median Age (Female) | Median Age (Male) |
|---|---|---|---|
| Prato | 40.6 yrs | 41.4 yrs | 39.9 yrs |
| Italy | 40.9 yrs | 41.5 yrs | 40.3 yrs |
Prato Population Density
Population Density: 1,774 / km²
| Location | Population | Area | Density |
|---|---|---|---|
| Prato | 192,983 | 108.8 km² | 1,774 / km² |
| Italy | 59.3 million | 301,510.7 km² | 197 / km² |
Prato Historical and Projected Population
Estimated Population from 0 to 2100
- JRC (European Commission's Joint Research Centre) work on the GHS built-up grid
- CIESIN (Center for International Earth Science Information Network)
- [Link] Klein Goldewijk, K., Beusen, A., Doelman, J., and Stehfest, E.: Anthropogenic land use estimates for the Holocene – HYDE 3.2, Earth Syst. Sci. Data, 9, 927–953, https://doi.org/10.5194/essd-9-927-2017, 2017.
Neighborhoods in Prato
Percentage of businesses by neighborhood in Prato
Price Distribution
Business distribution by price for Prato
Human Development Index (HDI)
Statistic composite index of life expectancy, education, and per capita income.
Prato CO2 Emissions
Carbon Dioxide (CO2) Emissions Per Capita in Tonnes Per Year
| Location | CO2 Emissions | CO2 Emissions Per Capita | CO2 Emissions Intensity |
|---|---|---|---|
| Prato | 1,381,164 tn | 7.16 tn | 12,693.1 tons/km² |
| Italy | 399,008,505 tn | 6.73 tn | 1,323.4 tons/km² |
| 2013 CO2 emissions (tonnes/year) | 1,381,164 tn |
| 2013 CO2 emissions (tonnes/year) per capita | 7.16 tn |
| 2013 CO2 emissions intensity (tonnes/km²/year) | 12,693.1 tons/km² |
Natural Hazards Risk
Relative risk out of 10
| Hazard | Risk Level |
|---|---|
| Earthquake | Medium (6) |
| Landslide | Medium (6) |
* Risk, particularly concerning flood or landslide, may not be for the entire area.
- Dilley, M., R.S. Chen, U. Deichmann, A.L. Lerner-Lam, M. Arnold, J. Agwe, P. Buys, O. Kjekstad, B. Lyon, and G. Yetman. 2005. Natural Disaster Hotspots: A Global Risk Analysis. Washington, D.C.: World Bank. https://doi.org/10.1596/0-8213-5930-4.
- Center for Hazards and Risk Research - CHRR - Columbia University, Center for International Earth Science Information Network - CIESIN - Columbia University, and Norwegian Geotechnical Institute - NGI. 2005. Global Landslide Hazard Distribution. Palisades, NY: NASA Socioeconomic Data and Applications Center (SEDAC). https://doi.org/10.7927/H4P848VZ.
- Center for Hazards and Risk Research - CHRR - Columbia University, Center for International Earth Science Information Network - CIESIN - Columbia University. 2005. Global Earthquake Hazard Distribution - Peak Ground Acceleration. Palisades, NY: NASA Socioeconomic Data and Applications Center (SEDAC). https://doi.org/10.7927/H4BZ63ZS.
Recent Nearby Earthquakes
Magnitude 3.0 and greater
| Date▼ | Time↕ | Magnitude↕ | Distance↕ | Depth↕ | Location↕ | Link |
|---|---|---|---|---|---|---|
| 10/25/16 | 4:53 PM | 4.2 | 31 km | 10,000 m | 5km NNE of Certaldo, Italy | usgs.gov |
| 9/13/15 | 1:04 AM | 4.2 | 38.4 km | 4,110 m | 4km SW of Greve, Italy | usgs.gov |
| 7/22/15 | 12:57 PM | 3.6 | 35.4 km | 10,000 m | 0km WSW of Lizzano in Belvedere, Italy | usgs.gov |
| 3/4/15 | 12:00 AM | 4 | 30.8 km | 9,200 m | 4km N of Tavarnelle Val di Pesa, Italy | usgs.gov |
| 3/3/15 | 11:51 PM | 3.3 | 31.9 km | 10,100 m | 3km N of Tavarnelle Val di Pesa, Italy | usgs.gov |
| 1/23/15 | 6:51 AM | 4.5 | 28.8 km | 9,700 m | 2km WSW of Castiglione dei Pepoli, Italy | usgs.gov |
| 12/19/14 | 10:36 AM | 3.9 | 32.9 km | 7,100 m | 5km WNW of Greve, Italy | usgs.gov |
| 12/19/14 | 9:39 AM | 3.8 | 33 km | 9,300 m | 5km WNW of Greve, Italy | usgs.gov |
| 4/17/13 | 2:50 PM | 3.3 | 23 km | 8,000 m | central Italy | usgs.gov |
| 9/14/09 | 8:04 PM | 4.6 | 28.2 km | 10,000 m | northern Italy | usgs.gov |
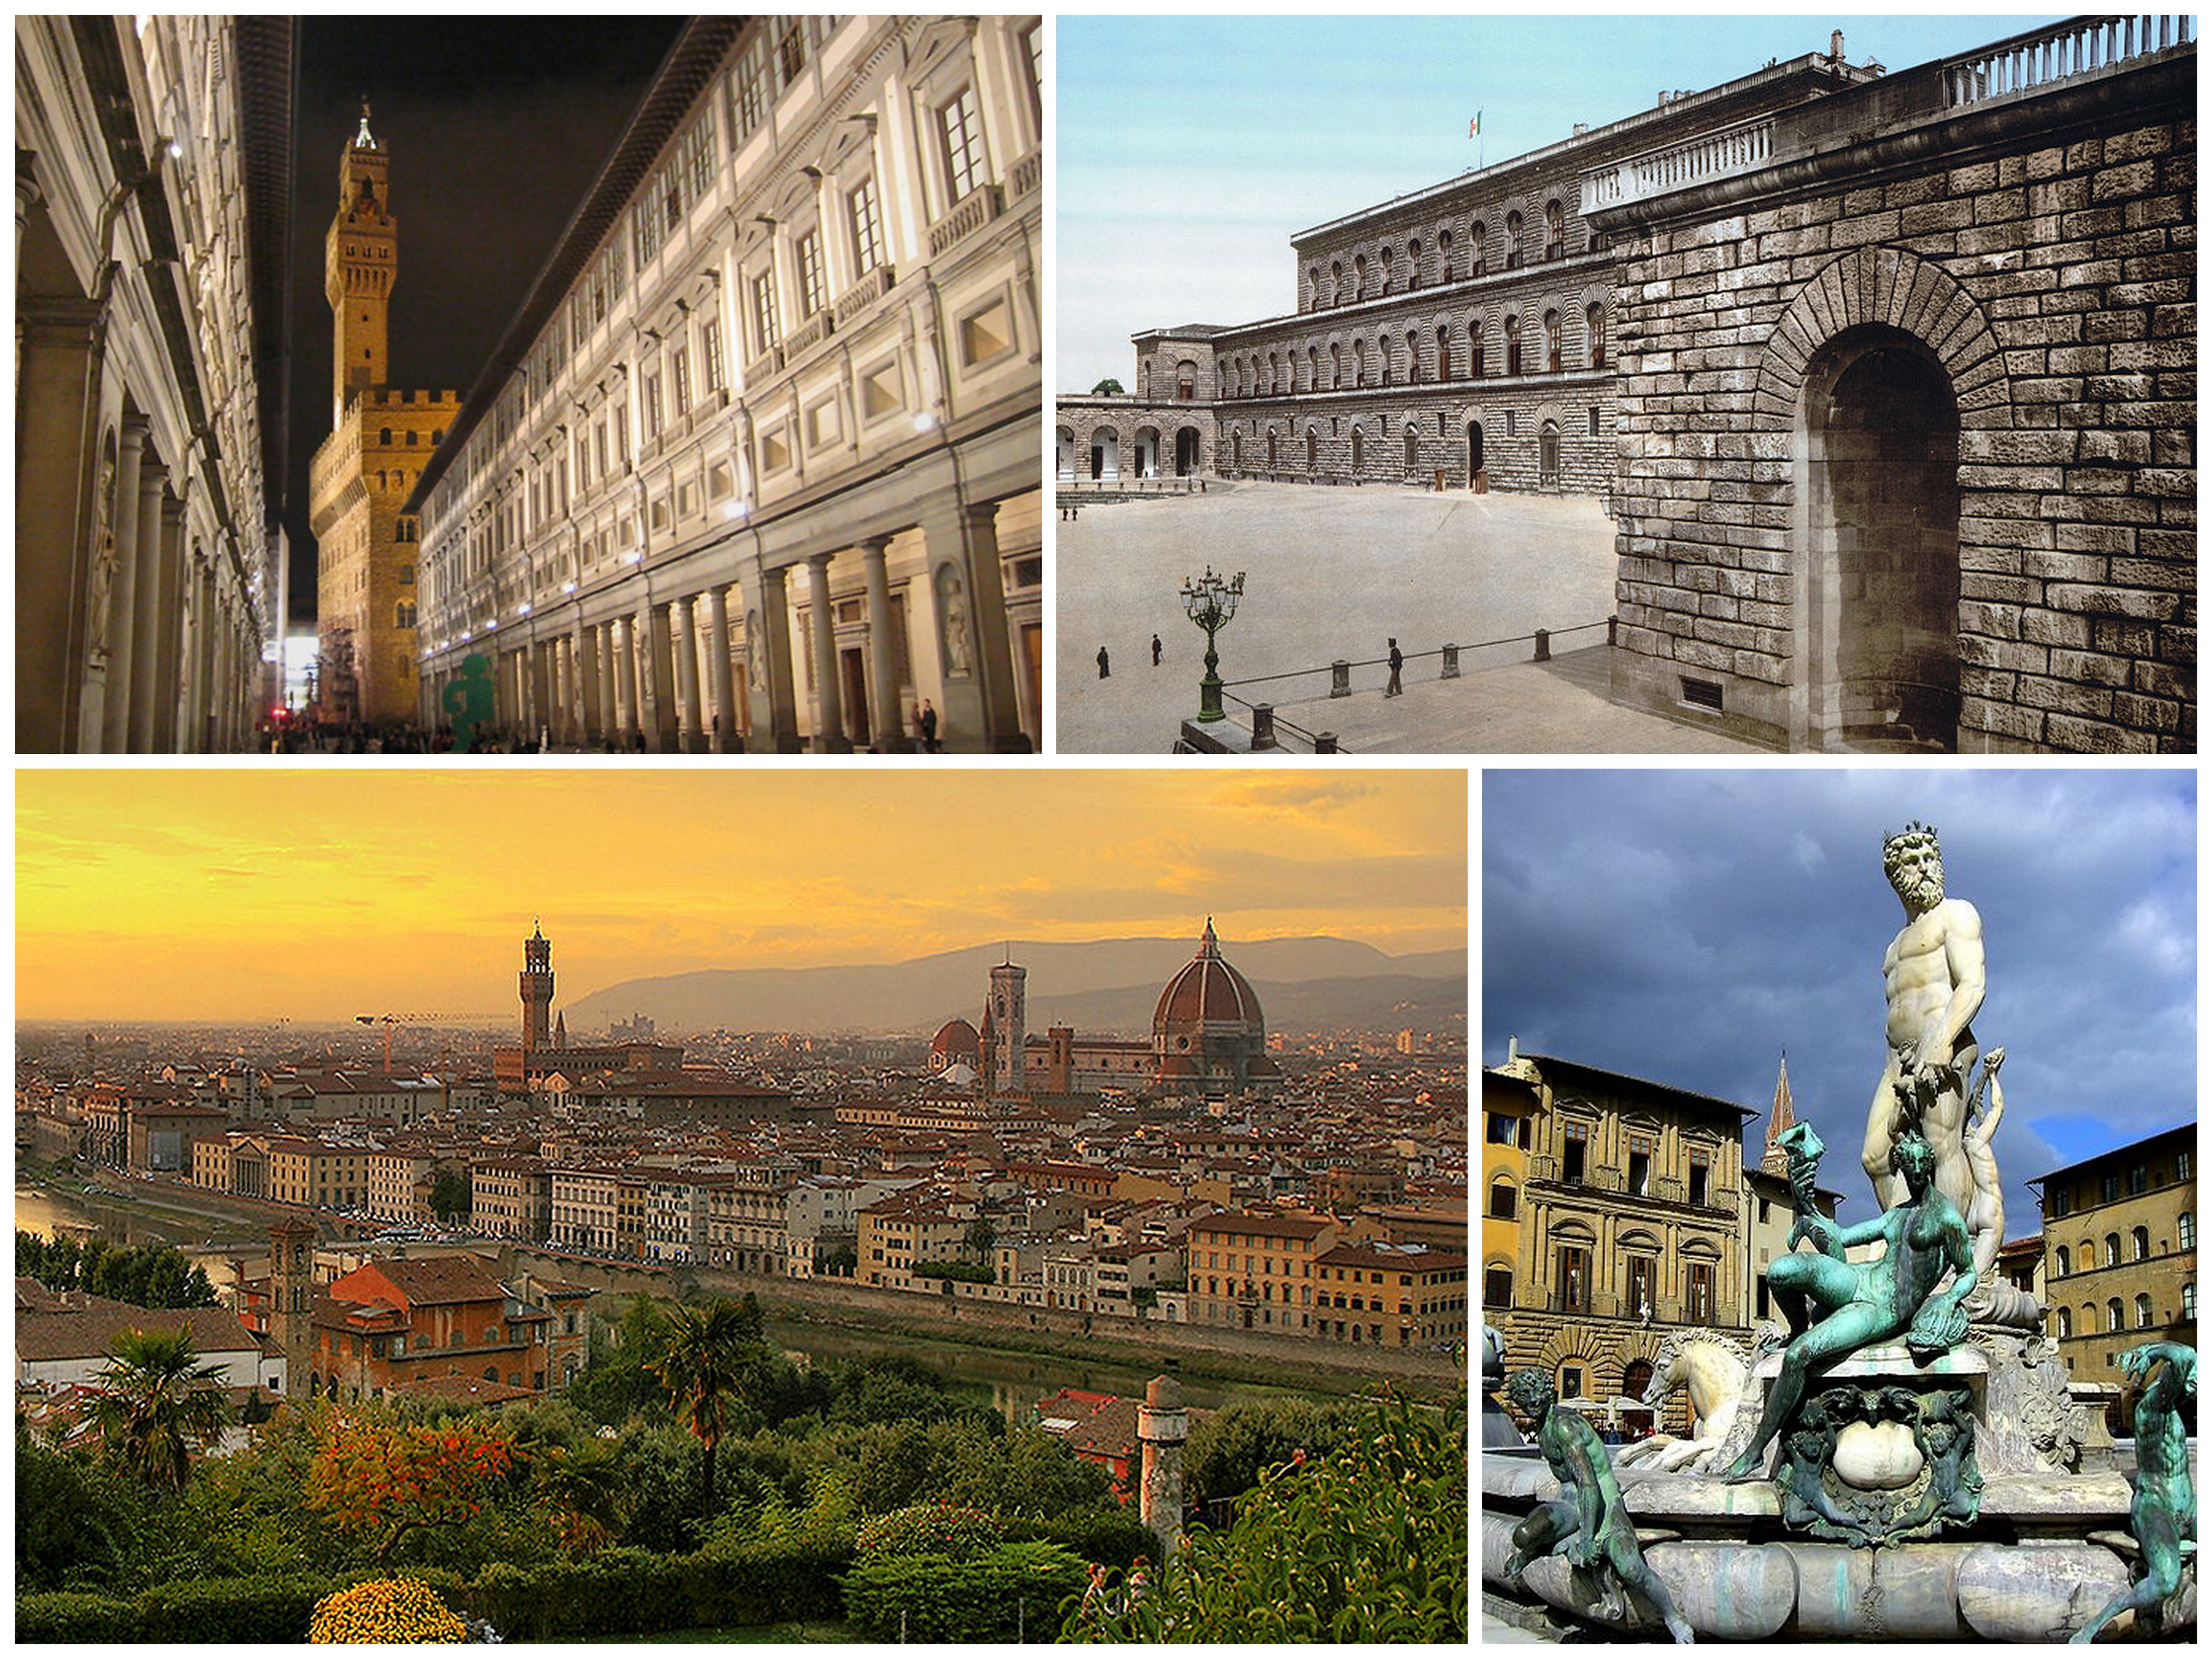
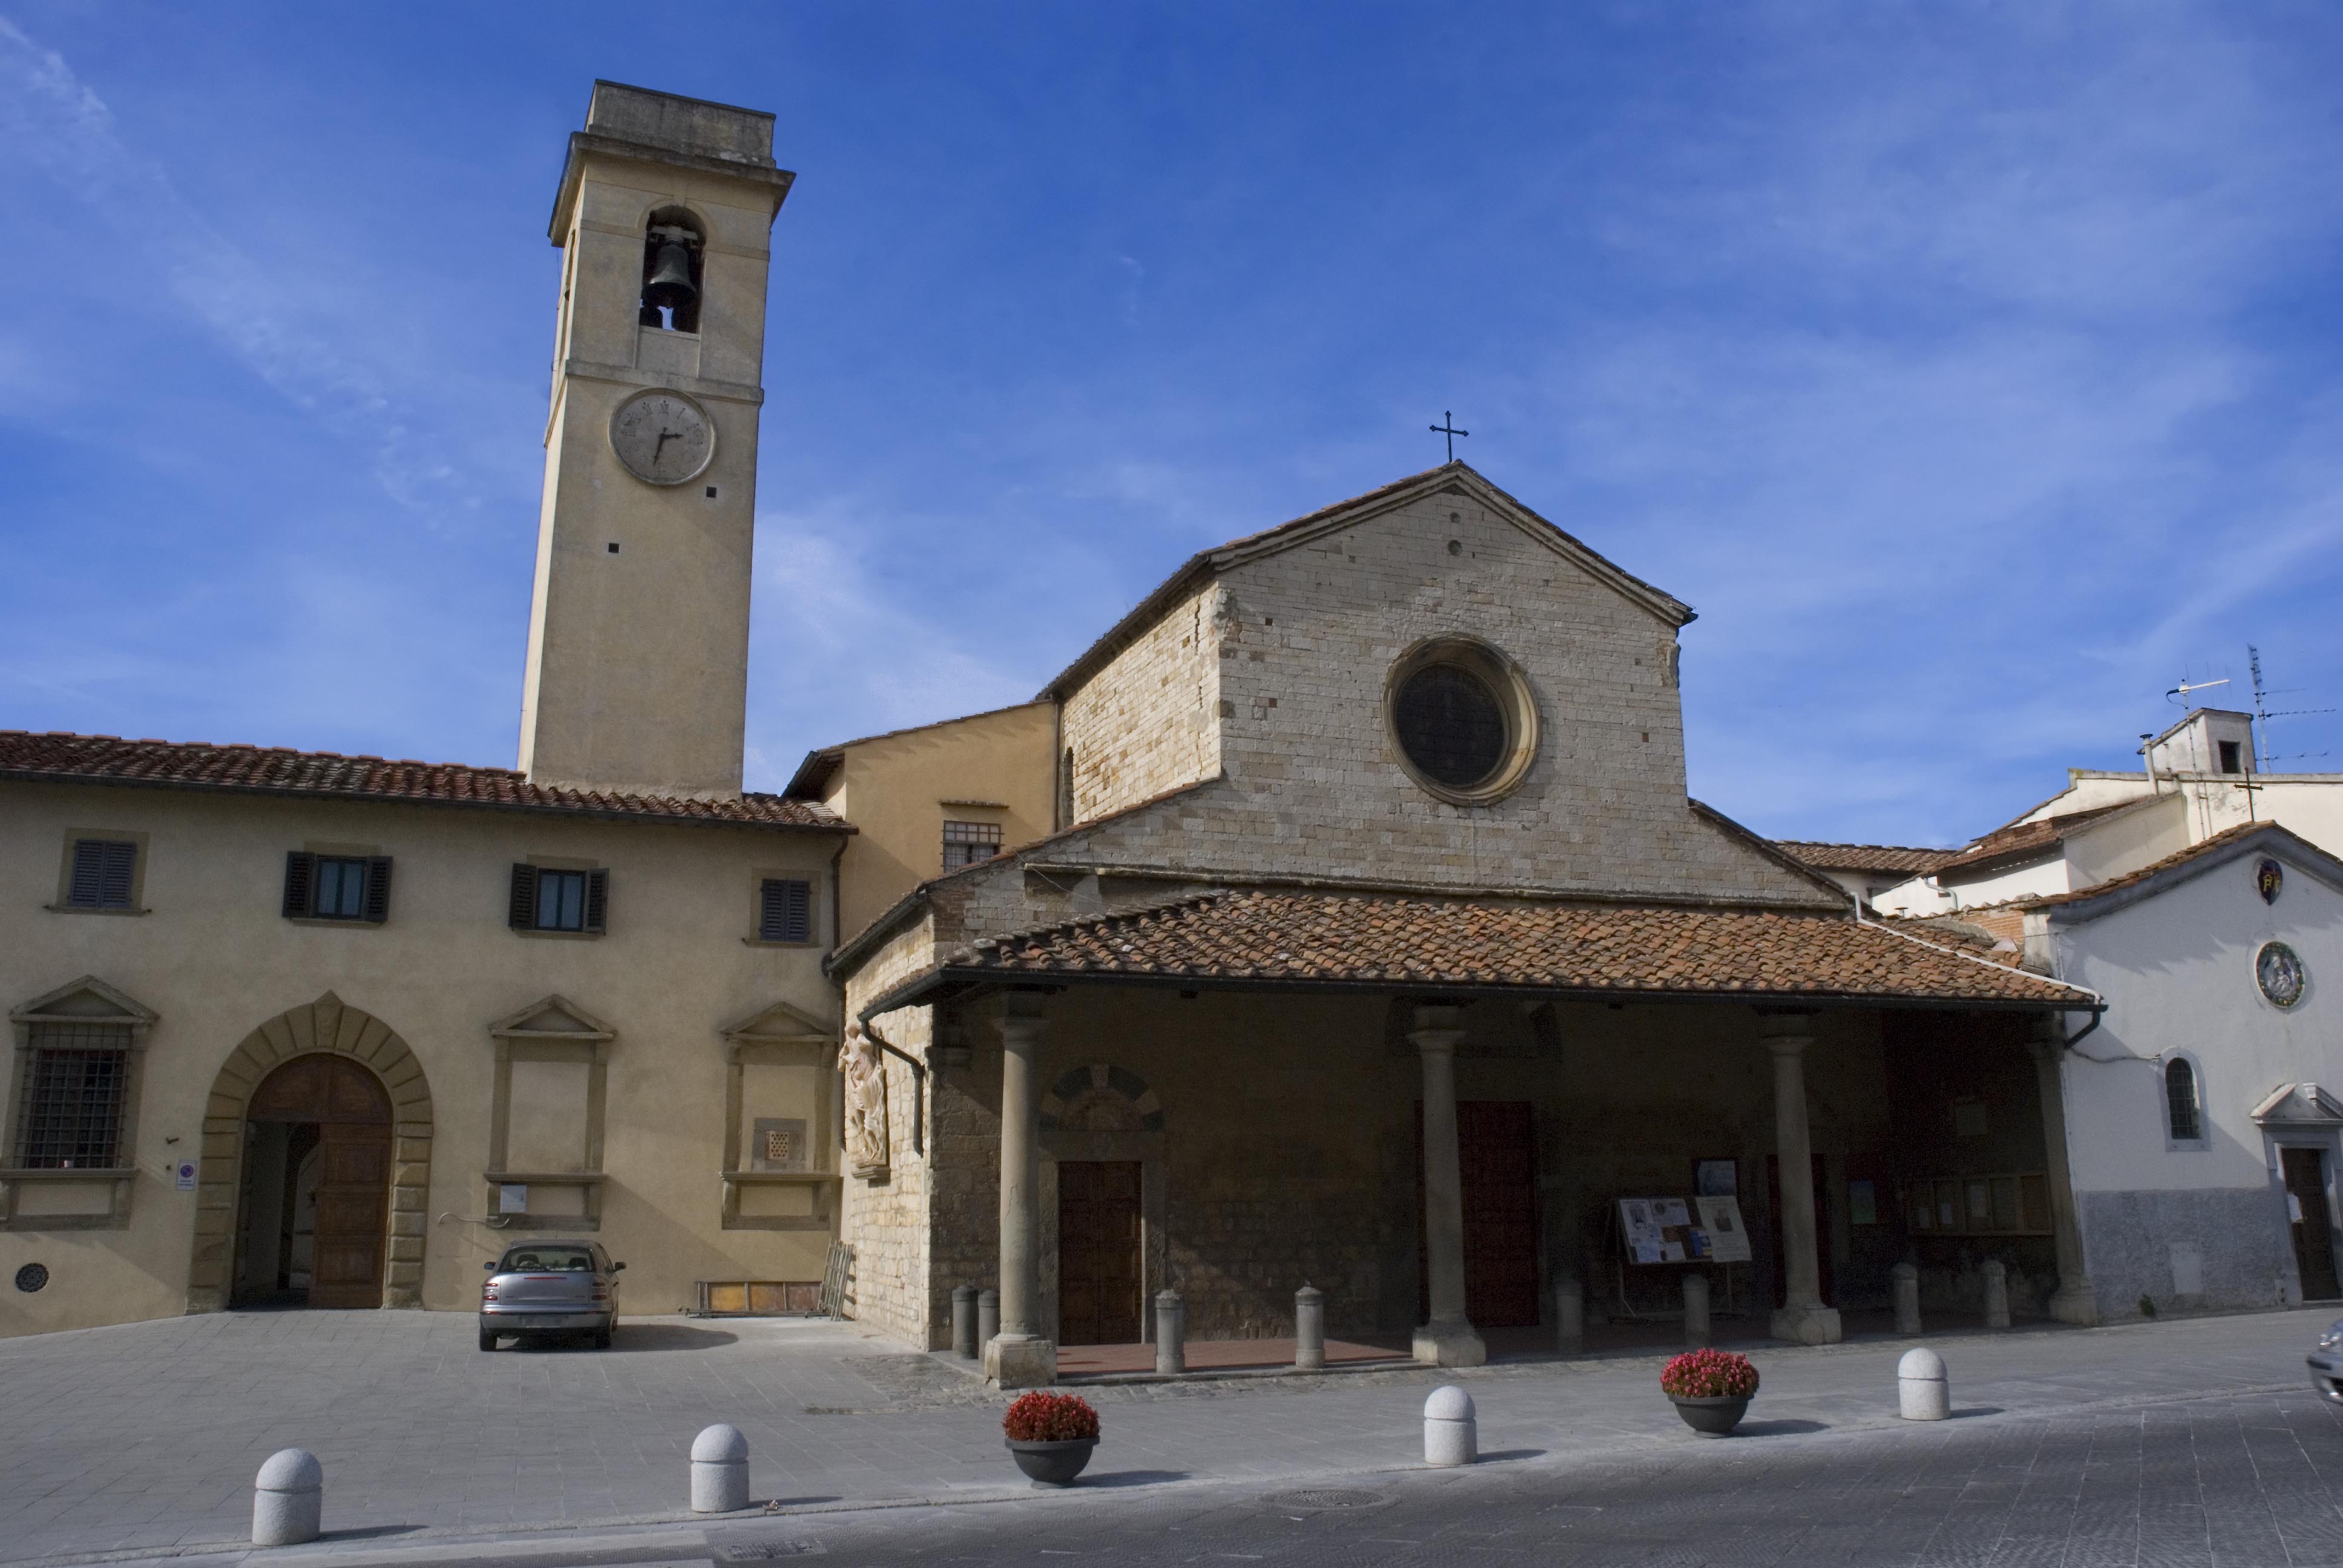
Prato
Prato (Italian pronunciation: [ˈpraːto]) is a city and comune in Tuscany, Italy, the capital of the Province of Prato. The city is at the foot of Monte Retaia, elevation 768 metres (2,520 ft), the last peak in the Calvana chain. The lowest elevation ..
Prato Wikipedia Page

About Our Data
The data on this page is estimated using a number of publicly available tools and resources. It is provided without warranty, and could contain inaccuracies. Use at your own risk.