Categories in Trenchtown
Trenchtown Facts
| Area | 5.0 km² |
| Population | 34,592 |
| Male Population | 17,225 (49.8%) |
| Female Population | 17,367 (50.2%) |
| Population change (1975 to 2020) | +9.3% |
| Population change (2000 to 2020) | +0.2% |
| Median Age | 27 years (Male: 26.5, Female: 27.6) |
| Local Time | |
| Timezone | Eastern Standard Time |
| Lat & Lng | 17.98886, -76.79873 |
Map of Trenchtown
Interactive Map
Trenchtown Population
Years 1975 to 2020
| Data | 1975 | 1990 | 2000 | 2015 | 2020 |
|---|---|---|---|---|---|
| Population | 31,641 | 34,198 | 34,540 | 33,840 | 34,592 |
| Population Density | 6,328.2 / km² | 6,839.6 / km² | 6,908 / km² | 6,768 / km² | 6,918.4 / km² |
Trenchtown Population change from 2000 to 2015
Decrease of 2% from year 2000 to 2015
| Location | Change since 1975 | Change since 1990 | Change since 2000 |
|---|---|---|---|
| Trenchtown | +6.9% | -1% | -2% |
| Saint Andrew Parish, Jamaica | +37.4% | +16.4% | +7% |
| Jamaica | +38.7% | +17.2% | +7.5% |
Trenchtown Median Age
Median Age: 27 years
| Location | Median Age | Median Age (Female) | Median Age (Male) |
|---|---|---|---|
| Trenchtown | 27 yrs | 27.6 yrs | 26.5 yrs |
| Saint Andrew Parish, Jamaica | 29 yrs | 30 yrs | 28 yrs |
| Jamaica | 27.7 yrs | 28.3 yrs | 27.1 yrs |
Trenchtown Population Density
Population Density: 6,918 / km²
| Location | Population | Area | Density |
|---|---|---|---|
| Trenchtown | 34,592 | 5 km² | 6,918 / km² |
| Saint Andrew Parish, Jamaica | 561,790 | 434 km² | 1,294 / km² |
| Jamaica | 2.8 million | 10,985.3 km² | 252 / km² |
Trenchtown Historical and Projected Population
Estimated Population from 1400 to 2100
- JRC (European Commission's Joint Research Centre) work on the GHS built-up grid
- CIESIN (Center for International Earth Science Information Network)
- [Link] Klein Goldewijk, K., Beusen, A., Doelman, J., and Stehfest, E.: Anthropogenic land use estimates for the Holocene – HYDE 3.2, Earth Syst. Sci. Data, 9, 927–953, https://doi.org/10.5194/essd-9-927-2017, 2017.
Human Development Index (HDI)
Statistic composite index of life expectancy, education, and per capita income.
Trenchtown CO2 Emissions
Carbon Dioxide (CO2) Emissions Per Capita in Tonnes Per Year
| Location | CO2 Emissions | CO2 Emissions Per Capita | CO2 Emissions Intensity |
|---|---|---|---|
| Trenchtown | 48,421 tn | 1.4 tn | 9,684.2 tons/km² |
| Saint Andrew Parish, Jamaica | 2,270,176 tn | 4.04 tn | 5,230.5 tons/km² |
| Jamaica | 10,854,676 tn | 3.92 tn | 988.1 tons/km² |
| 2013 CO2 emissions (tonnes/year) | 48,421 tn |
| 2013 CO2 emissions (tonnes/year) per capita | 1.4 tn |
| 2013 CO2 emissions intensity (tonnes/km²/year) | 9,684.2 tons/km² |
Natural Hazards Risk
Relative risk out of 10
| Hazard | Risk Level |
|---|---|
| Flood | High (10) |
| Earthquake | Medium (7) |
| Cyclone | Medium (5) |
* Risk, particularly concerning flood or landslide, may not be for the entire area.
- Dilley, M., R.S. Chen, U. Deichmann, A.L. Lerner-Lam, M. Arnold, J. Agwe, P. Buys, O. Kjekstad, B. Lyon, and G. Yetman. 2005. Natural Disaster Hotspots: A Global Risk Analysis. Washington, D.C.: World Bank. https://doi.org/10.1596/0-8213-5930-4.
- Center for Hazards and Risk Research - CHRR - Columbia University, Center for International Earth Science Information Network - CIESIN - Columbia University, International Bank for Reconstruction and Development - The World Bank, and United Nations Environment Programme Global Resource Information Database Geneva - UNEP/GRID-Geneva. 2005. Global Cyclone Hazard Frequency and Distribution. Palisades, NY: NASA Socioeconomic Data and Applications Center (SEDAC). https://doi.org/10.7927/H4CZ353K.
- Center for Hazards and Risk Research - CHRR - Columbia University, Center for International Earth Science Information Network - CIESIN - Columbia University. 2005. Global Flood Hazard Frequency and Distribution. Palisades, NY: NASA Socioeconomic Data and Applications Center (SEDAC). https://doi.org/10.7927/H4668B3D.
- Center for Hazards and Risk Research - CHRR - Columbia University, Center for International Earth Science Information Network - CIESIN - Columbia University. 2005. Global Earthquake Hazard Distribution - Peak Ground Acceleration. Palisades, NY: NASA Socioeconomic Data and Applications Center (SEDAC). https://doi.org/10.7927/H4BZ63ZS.
Recent Nearby Earthquakes
Magnitude 3.0 and greater
| Date▼ | Time↕ | Magnitude↕ | Distance↕ | Depth↕ | Location↕ | Link |
|---|---|---|---|---|---|---|
| 10/8/18 | 2:28 AM | 3.4 | 32.6 km | 10,000 m | 2km SSW of Hope Bay, Jamaica | usgs.gov |
| 9/16/18 | 6:46 PM | 3.3 | 27.5 km | 10,000 m | 4km SW of Richmond, Jamaica | usgs.gov |
| 3/3/18 | 6:53 PM | 4 | 28.5 km | 14,190 m | 6km WSW of Hope Bay, Jamaica | usgs.gov |
| 12/21/16 | 6:00 PM | 4.3 | 32.4 km | 10,000 m | 6km ENE of Yallahs, Jamaica | usgs.gov |
| 3/28/16 | 4:42 AM | 3.7 | 54.7 km | 15,160 m | 5km WNW of Kellits, Jamaica | usgs.gov |
| 3/22/16 | 12:43 AM | 3.8 | 97.8 km | 10,000 m | 43km ENE of Manchioneal, Jamaica | usgs.gov |
| 5/12/14 | 1:44 AM | 3.3 | 17.2 km | 10,000 m | 7km N of Stony Hill, Jamaica | usgs.gov |
| 9/20/13 | 5:34 AM | 3.2 | 25 km | 16,480 m | 10km SSW of Hope Bay, Jamaica | usgs.gov |
| 9/9/13 | 1:20 AM | 3.2 | 19 km | 10,000 m | 11km SSW of Port Royal, Jamaica | usgs.gov |
| 5/6/11 | 9:29 AM | 4.2 | 22.1 km | 4,900 m | Jamaica region | usgs.gov |
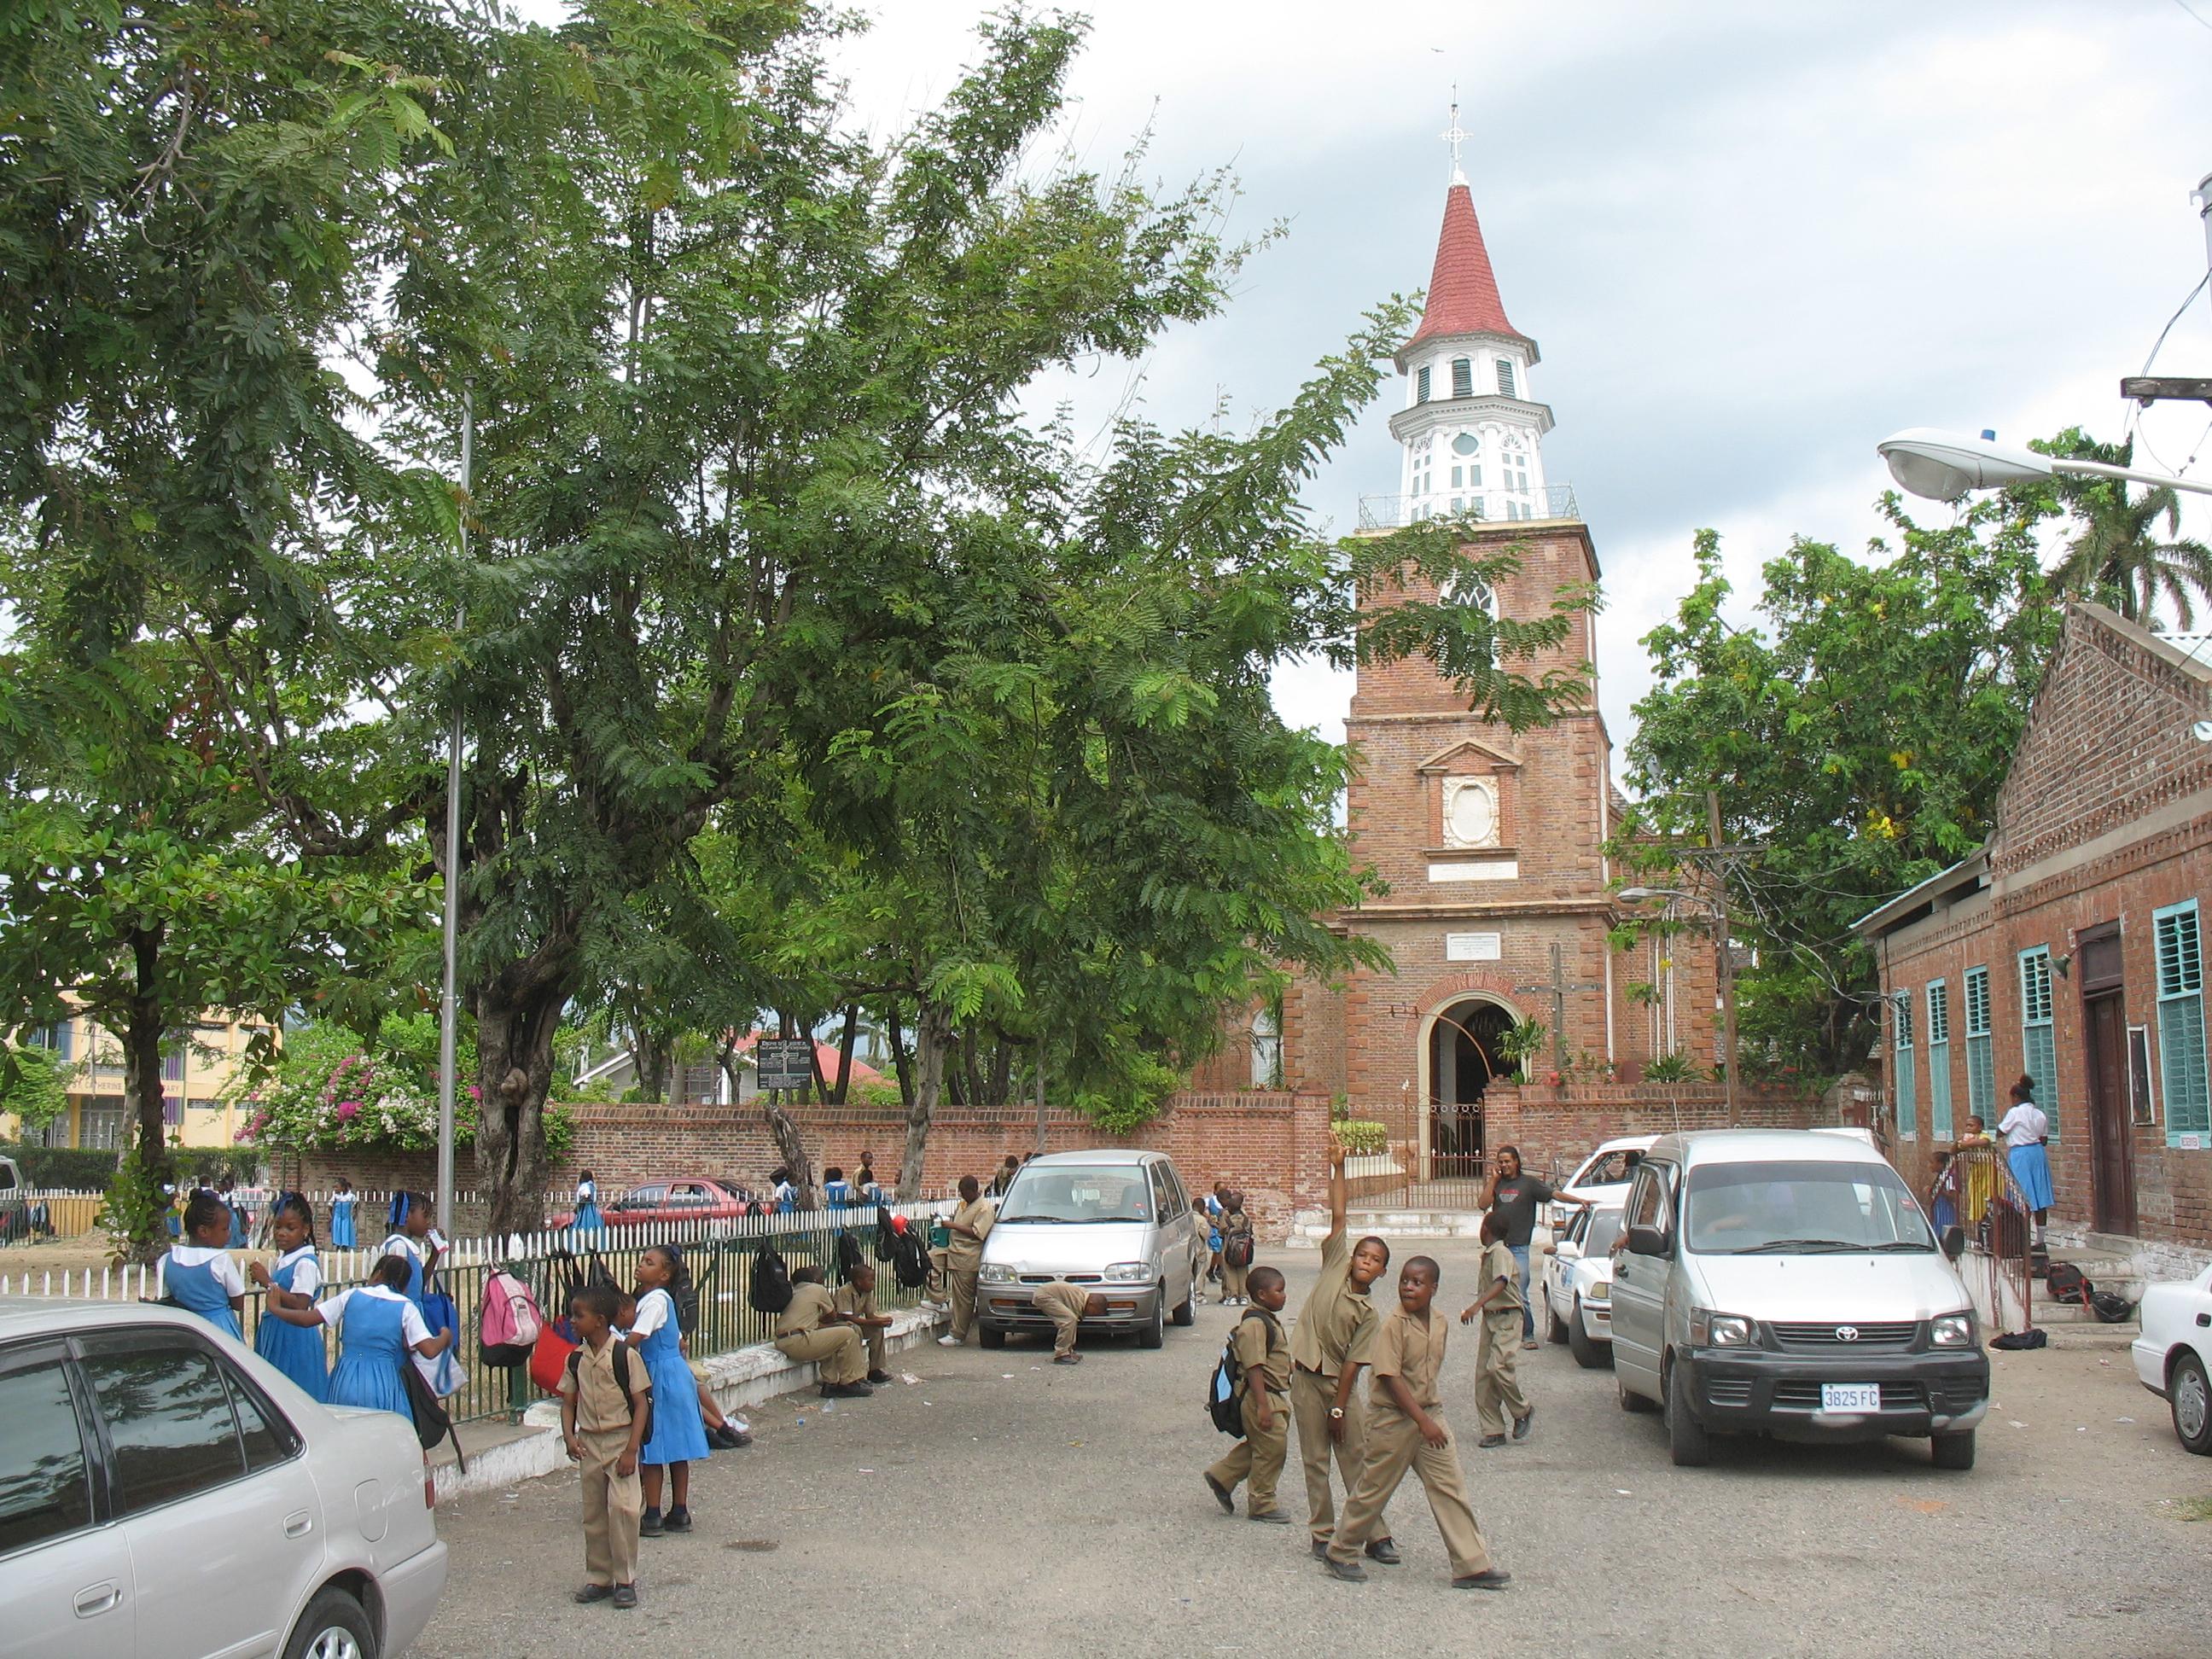
Trenchtown
Trench Town (also Trenchtown) is a neighborhood located in the parish of St. Andrew which shares municipality with Kingston, the capital and largest city of Jamaica. In the 1960s Trench Town was known as the Hollywood of Jamaica. Today Trench Town bo..
Trenchtown Wikipedia Page

About Our Data
The data on this page is estimated using a number of publicly available tools and resources. It is provided without warranty, and could contain inaccuracies. Use at your own risk.