Categories in Nago
Industries
Business Distribution by Industry in Nago
| Industry Description | Number of Establishments |
|---|---|
| Restaurants | 114 |
| Construction of buildings | 61 |
| Apartments | 46 |
| Japanese restaurants | 44 |
| Other accommodation | 43 |
| Travel agencies | 42 |
| Cafes | 36 |
| Hotels and motels | 35 |
| Hairdressers | 30 |
| Bars, pubs and taverns | 29 |
| All food and beverage | 27 |
| Shopping | 26 |
| Real estate | 25 |
| Beauty salons | 24 |
| Museums | 21 |
Nago Facts
| Area | 9.1 km² |
| Population | 1,743 |
| Male Population | 870 (49.9%) |
| Female Population | 873 (50.1%) |
| Population change (1975 to 2020) | +88.8% |
| Population change (2000 to 2020) | +31.6% |
| Median Age | 39.5 years (Male: 38.7, Female: 40.5) |
| Area Codes | 980 |
| Neighborhoods | Biimata, Umusa, Gusuku, 1 Chome, Isagawa, Miyazato |
| Local Time | |
| Timezone | Japan Standard Time |
| Lat & Lng | 26.61502, 127.98543 |
| Postal Codes | 905 |
Map of Nago
Interactive Map
Nago Population
Years 1975 to 2020
| Data | 1975 | 1990 | 2000 | 2015 | 2020 |
|---|---|---|---|---|---|
| Population | 923 | 1,233 | 1,324 | 1,741 | 1,743 |
| Population Density | 101.2 / km² | 135.1 / km² | 145.1 / km² | 190.8 / km² | 191 / km² |
Nago Population change from 2000 to 2015
Increase of 31.5% from year 2000 to 2015
| Location | Change since 1975 | Change since 1990 | Change since 2000 |
|---|---|---|---|
| Nago | +88.6% | +41.2% | +31.5% |
| Okinawa Prefecture | +33.2% | +14.4% | +6.5% |
| Japan | +13.6% | +3.4% | +0.6% |
Nago Median Age
Median Age: 39.5 years
| Location | Median Age | Median Age (Female) | Median Age (Male) |
|---|---|---|---|
| Nago | 39.5 yrs | 40.5 yrs | 38.7 yrs |
| Okinawa Prefecture | 40 yrs | 40.9 yrs | 39.1 yrs |
| Japan | 45.1 yrs | 46.9 yrs | 43.5 yrs |
Nago Population Density
Population Density: 191 / km²
| Location | Population | Area | Density |
|---|---|---|---|
| Nago | 1,743 | 9.1 km² | 191 / km² |
| Okinawa Prefecture | 1.3 million | 2,262.4 km² | 592 / km² |
| Japan | 122.9 million | 373,410.9 km² | 329 / km² |
Nago Historical and Projected Population
Estimated Population from 500 to 2100
- JRC (European Commission's Joint Research Centre) work on the GHS built-up grid
- CIESIN (Center for International Earth Science Information Network)
- [Link] Klein Goldewijk, K., Beusen, A., Doelman, J., and Stehfest, E.: Anthropogenic land use estimates for the Holocene – HYDE 3.2, Earth Syst. Sci. Data, 9, 927–953, https://doi.org/10.5194/essd-9-927-2017, 2017.
Neighborhoods in Nago
Percentage of businesses by neighborhood in Nago
Price Distribution
Business distribution by price for Nago
Human Development Index (HDI)
Statistic composite index of life expectancy, education, and per capita income.
Nago CO2 Emissions
Carbon Dioxide (CO2) Emissions Per Capita in Tonnes Per Year
| Location | CO2 Emissions | CO2 Emissions Per Capita | CO2 Emissions Intensity |
|---|---|---|---|
| Nago | 198 tn | 0.11 tn | 21.7 tons/km² |
| Okinawa Prefecture | 927,666 tn | 0.69 tn | 410 tons/km² |
| Japan | 541,995,101 tn | 4.41 tn | 1,451.5 tons/km² |
| 2013 CO2 emissions (tonnes/year) | 198 tn |
| 2013 CO2 emissions (tonnes/year) per capita | 0.11 tn |
| 2013 CO2 emissions intensity (tonnes/km²/year) | 21.7 tons/km² |
Natural Hazards Risk
Relative risk out of 10
| Hazard | Risk Level |
|---|---|
| Cyclone | High (10) |
* Risk, particularly concerning flood or landslide, may not be for the entire area.
- Dilley, M., R.S. Chen, U. Deichmann, A.L. Lerner-Lam, M. Arnold, J. Agwe, P. Buys, O. Kjekstad, B. Lyon, and G. Yetman. 2005. Natural Disaster Hotspots: A Global Risk Analysis. Washington, D.C.: World Bank. https://doi.org/10.1596/0-8213-5930-4.
- Center for Hazards and Risk Research - CHRR - Columbia University, Center for International Earth Science Information Network - CIESIN - Columbia University, International Bank for Reconstruction and Development - The World Bank, and United Nations Environment Programme Global Resource Information Database Geneva - UNEP/GRID-Geneva. 2005. Global Cyclone Hazard Frequency and Distribution. Palisades, NY: NASA Socioeconomic Data and Applications Center (SEDAC). https://doi.org/10.7927/H4CZ353K.
Recent Nearby Earthquakes
Magnitude 3.0 and greater
| Date▼ | Time↕ | Magnitude↕ | Distance↕ | Depth↕ | Location↕ | Link |
|---|---|---|---|---|---|---|
| 7/21/19 | 9:37 PM | 4.5 | 44.3 km | 30,040 m | 47km N of Nago, Japan | usgs.gov |
| 7/21/19 | 9:15 PM | 4.4 | 29.7 km | 10,000 m | 31km NW of Nago, Japan | usgs.gov |
| 7/21/19 | 9:13 PM | 4.6 | 26.1 km | 10,000 m | 26km WNW of Nago, Japan | usgs.gov |
| 4/16/19 | 9:19 AM | 4.5 | 64.7 km | 74,230 m | 67km NNE of Nago, Japan | usgs.gov |
| 1/24/19 | 12:15 PM | 4.8 | 32.5 km | 42,250 m | 35km NNE of Nago, Japan | usgs.gov |
| 5/10/18 | 11:34 PM | 4.5 | 26.7 km | 31,370 m | 28km ENE of Nago, Japan | usgs.gov |
| 3/6/18 | 12:19 PM | 4.6 | 18.6 km | 50,390 m | 18km WNW of Nago, Japan | usgs.gov |
| 11/22/17 | 8:30 PM | 4.4 | 21.8 km | 44,490 m | 10km NNW of Ishikawa, Japan | usgs.gov |
| 9/5/17 | 6:56 AM | 4.5 | 22.1 km | 46,020 m | 18km NNW of Ishikawa, Japan | usgs.gov |
| 9/2/17 | 9:26 PM | 4.3 | 65 km | 12,070 m | 55km ESE of Haebaru, Japan | usgs.gov |
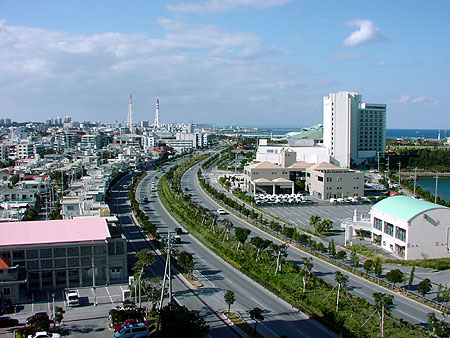
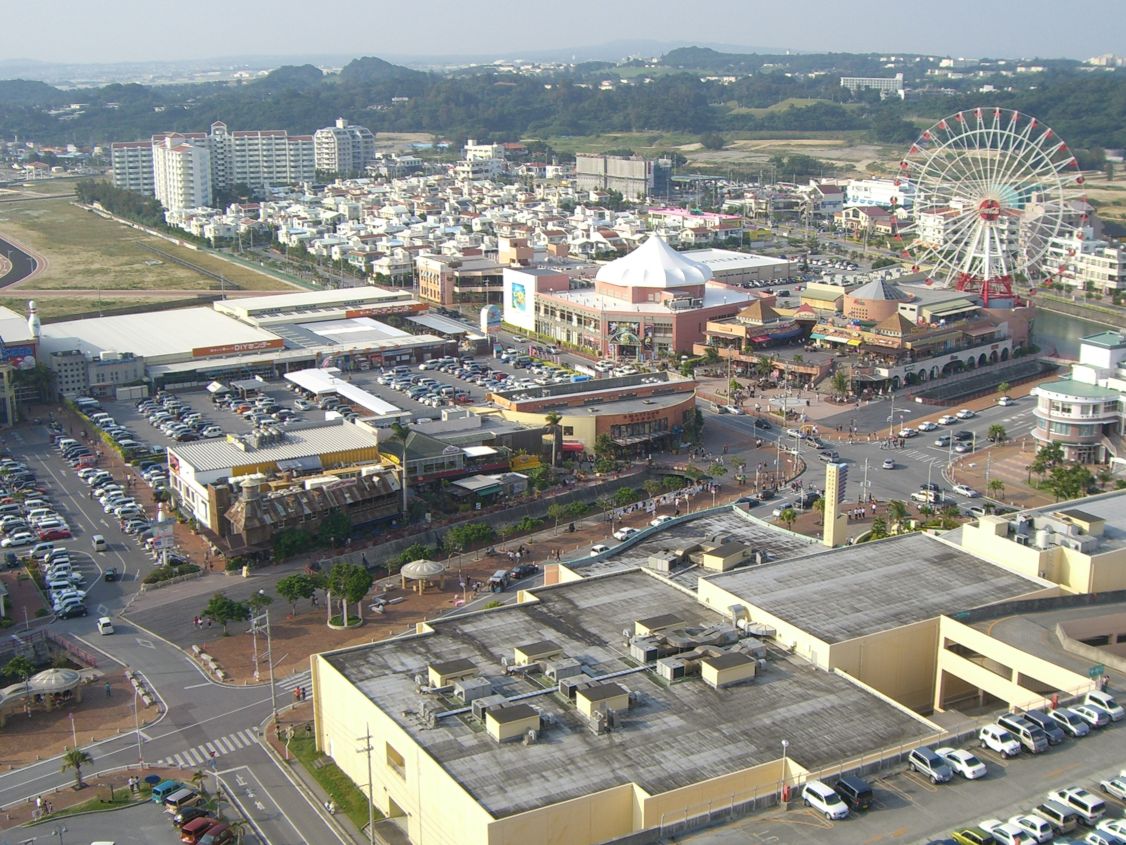
Nago
Nago (名護市, Nago-shi, Okinawan: Nagu) is a city located in the northern part of Okinawa Island, Okinawa Prefecture, Japan. As of December 2012, the city has an estimated population of 61,659 and a population density of 288 persons per km2. Its total a..
Nago Wikipedia Page
About Our Data
The data on this page is estimated using a number of publicly available tools and resources. It is provided without warranty, and could contain inaccuracies. Use at your own risk.