Categories in Litein
Industries
Business Distribution by Industry in Litein
| Industry Description | Number of Establishments |
|---|---|
| Education | 81 |
| Shopping | 58 |
| Churches | 52 |
| Banks | 30 |
| Restaurants | 22 |
| Primary and elementary schools | 21 |
| Hospitals | 17 |
| Hardware store | 16 |
| Grocery stores and supermarkets | 13 |
| Electronics stores | 12 |
| Hotels and motels | 12 |
| Shopping other | 12 |
Litein Facts
| Area | 0.9 km² |
| Population | 7,061 |
| Male Population | 3,456 (48.9%) |
| Female Population | 3,605 (51.1%) |
| Population change (1975 to 2020) | +347.7% |
| Population change (2000 to 2020) | +62.3% |
| Median Age | 17.3 years (Male: 17.4, Female: 17.2) |
| Area Codes | 52 |
| Local Time | |
| Timezone | East Africa Time |
| Lat & Lng | -0.58226, 35.19029 |
Map of Litein
Interactive Map
Litein Population
Years 1975 to 2020
| Data | 1975 | 1990 | 2000 | 2015 | 2020 |
|---|---|---|---|---|---|
| Population | 1,577 | 2,974 | 4,350 | 6,289 | 7,061 |
| Population Density | 1,802.3 / km² | 3,398.9 / km² | 4,971.4 / km² | 7,187.4 / km² | 8,069.7 / km² |
Litein Population change from 2000 to 2015
Increase of 44.6% from year 2000 to 2015
| Location | Change since 1975 | Change since 1990 | Change since 2000 |
|---|---|---|---|
| Litein | +298.8% | +111.5% | +44.6% |
| Kenya | +241.7% | +96.8% | +48.4% |
Litein Median Age
Median Age: 17.3 years
| Location | Median Age | Median Age (Female) | Median Age (Male) |
|---|---|---|---|
| Litein | 17.3 yrs | 17.2 yrs | 17.4 yrs |
| Kenya | 18 yrs | 18.4 yrs | 17.6 yrs |
Litein Population Density
Population Density: 8,070 / km²
| Location | Population | Area | Density |
|---|---|---|---|
| Litein | 7,061 | 0.875 km² | 8,070 / km² |
| Kenya | 45.8 million | 582,723.1 km² | 78.6 / km² |
Litein Historical and Projected Population
Estimated Population from 1820 to 2100
- JRC (European Commission's Joint Research Centre) work on the GHS built-up grid
- CIESIN (Center for International Earth Science Information Network)
- [Link] Klein Goldewijk, K., Beusen, A., Doelman, J., and Stehfest, E.: Anthropogenic land use estimates for the Holocene – HYDE 3.2, Earth Syst. Sci. Data, 9, 927–953, https://doi.org/10.5194/essd-9-927-2017, 2017.
Area Codes
Percentage Area Codes used by businesses in Litein
Price Distribution
Business distribution by price for Litein
Human Development Index (HDI)
Statistic composite index of life expectancy, education, and per capita income.
Litein CO2 Emissions
Carbon Dioxide (CO2) Emissions Per Capita in Tonnes Per Year
| Location | CO2 Emissions | CO2 Emissions Per Capita | CO2 Emissions Intensity |
|---|---|---|---|
| Litein | 5,796 tn | 0.82 tn | 6,624.2 tons/km² |
| Kenya | 27,341,523 tn | 0.6 tn | 46.9 tons/km² |
| 2013 CO2 emissions (tonnes/year) | 5,796 tn |
| 2013 CO2 emissions (tonnes/year) per capita | 0.82 tn |
| 2013 CO2 emissions intensity (tonnes/km²/year) | 6,624.2 tons/km² |
Natural Hazards Risk
Relative risk out of 10
| Hazard | Risk Level |
|---|---|
| Drought | Medium (4) |
| Flood | High (9) |
| Earthquake | Medium (4) |
* Risk, particularly concerning flood or landslide, may not be for the entire area.
- Dilley, M., R.S. Chen, U. Deichmann, A.L. Lerner-Lam, M. Arnold, J. Agwe, P. Buys, O. Kjekstad, B. Lyon, and G. Yetman. 2005. Natural Disaster Hotspots: A Global Risk Analysis. Washington, D.C.: World Bank. https://doi.org/10.1596/0-8213-5930-4.
- Center for Hazards and Risk Research - CHRR - Columbia University, Center for International Earth Science Information Network - CIESIN - Columbia University, and International Research Institute for Climate and Society - IRI - Columbia University. 2005. Global Drought Hazard Frequency and Distribution. Palisades, NY: NASA Socioeconomic Data and Applications Center (SEDAC). https://doi.org/10.7927/H4VX0DFT.
- Center for Hazards and Risk Research - CHRR - Columbia University, Center for International Earth Science Information Network - CIESIN - Columbia University. 2005. Global Flood Hazard Frequency and Distribution. Palisades, NY: NASA Socioeconomic Data and Applications Center (SEDAC). https://doi.org/10.7927/H4668B3D.
- Center for Hazards and Risk Research - CHRR - Columbia University, Center for International Earth Science Information Network - CIESIN - Columbia University. 2005. Global Earthquake Hazard Distribution - Peak Ground Acceleration. Palisades, NY: NASA Socioeconomic Data and Applications Center (SEDAC). https://doi.org/10.7927/H4BZ63ZS.
Recent Nearby Earthquakes
Magnitude 3.0 and greater
| Date▼ | Time↕ | Magnitude↕ | Distance↕ | Depth↕ | Location↕ | Link |
|---|---|---|---|---|---|---|
| 6/13/10 | 12:13 PM | 5 | 88.7 km | 10,000 m | Lake Victoria region, Kenya | usgs.gov |
Litein
Litein is a small town in the Kericho County, Kenya. It was previously the capital of the former Buret District. Litein has an urban population of 2,300. The town is along the Kericho-Sotik road. It also has a road link to Bomet. 's name originated f..
Litein Wikipedia Page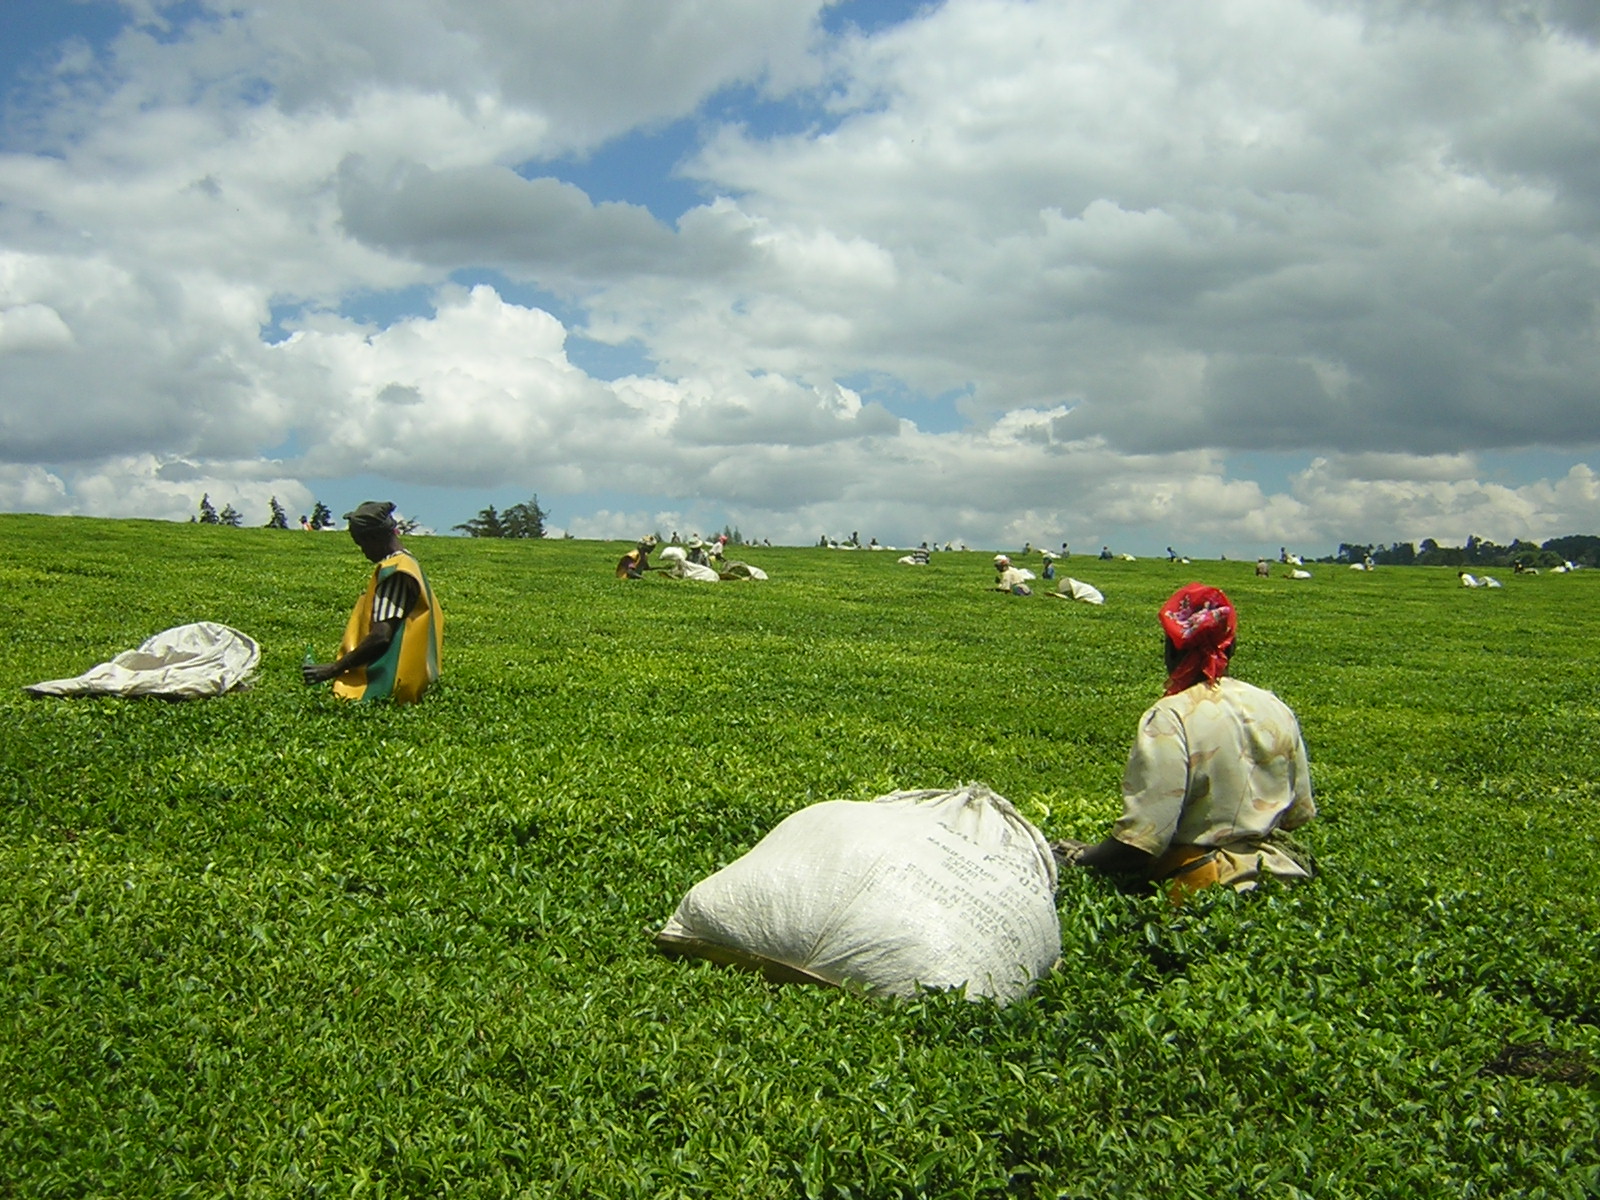
About Our Data
The data on this page is estimated using a number of publicly available tools and resources. It is provided without warranty, and could contain inaccuracies. Use at your own risk.