Categories in Pasvalys
Industries
Business Distribution by Industry in Pasvalys
| Industry Description | Number of Establishments |
|---|---|
| Shopping | 30 |
| Restaurants | 25 |
| Shopping other | 24 |
| Car repair | 21 |
| All membership organizations | 21 |
| Corporate management | 21 |
| Pharmacies and drug stores | 19 |
| Wholesale of construction supplies | 16 |
| Hospitals | 13 |
| Construction of buildings | 12 |
| Education | 12 |
| Transportation logistics | 11 |
| Sports clubs | 10 |
Pasvalys Facts
| Area | 5.4 km² |
| Population | 8,234 |
| Male Population | 3,973 (48.3%) |
| Female Population | 4,261 (51.7%) |
| Population change (1975 to 2020) | -50.1% |
| Population change (2000 to 2020) | -36.4% |
| Median Age | 41 years (Male: 38.7, Female: 43.1) |
| Area Codes | 451 |
| Local Time | |
| Timezone | Eastern European Summer Time |
| Lat & Lng | 56.05944, 24.40361 |
| Postal Codes | 39001, 39103, 39104, 39105, 39106, More |
Map of Pasvalys
Interactive Map
Pasvalys Population
Years 1975 to 2020
| Data | 1975 | 1990 | 2000 | 2015 | 2020 |
|---|---|---|---|---|---|
| Population | 16,492 | 15,759 | 12,948 | 8,577 | 8,234 |
| Population Density | 3,068.3 / km² | 2,931.9 / km² | 2,408.9 / km² | 1,595.7 / km² | 1,531.9 / km² |
Pasvalys Population change from 2000 to 2015
Decrease of 33.8% from year 2000 to 2015
| Location | Change since 1975 | Change since 1990 | Change since 2000 |
|---|---|---|---|
| Pasvalys | -48% | -45.6% | -33.8% |
| Panevėžys County | -29.7% | -33% | -25.1% |
| Lithuania | -12.8% | -22.2% | -17.4% |
Pasvalys Median Age
Median Age: 41 years
| Location | Median Age | Median Age (Female) | Median Age (Male) |
|---|---|---|---|
| Pasvalys | 41 yrs | 43.1 yrs | 38.7 yrs |
| Panevėžys County | 41.9 yrs | 44.2 yrs | 39.4 yrs |
| Lithuania | 39.7 yrs | 42.1 yrs | 37 yrs |
Pasvalys Population Density
Population Density: 1,532 / km²
| Location | Population | Area | Density |
|---|---|---|---|
| Pasvalys | 8,234 | 5.4 km² | 1,532 / km² |
| Panevėžys County | 229,857 | 7,884.3 km² | 29.2 / km² |
| Lithuania | 2.9 million | 65,263.1 km² | 44.1 / km² |
Pasvalys Historical and Projected Population
Estimated Population from 1100 to 2100
- JRC (European Commission's Joint Research Centre) work on the GHS built-up grid
- CIESIN (Center for International Earth Science Information Network)
- [Link] Klein Goldewijk, K., Beusen, A., Doelman, J., and Stehfest, E.: Anthropogenic land use estimates for the Holocene – HYDE 3.2, Earth Syst. Sci. Data, 9, 927–953, https://doi.org/10.5194/essd-9-927-2017, 2017.
Area Codes
Percentage Area Codes used by businesses in Pasvalys
Postal Codes
Percentage of businesses by Postal Codes in Pasvalys
Price Distribution
Business distribution by price for Pasvalys
Human Development Index (HDI)
Statistic composite index of life expectancy, education, and per capita income.
Pasvalys CO2 Emissions
Carbon Dioxide (CO2) Emissions Per Capita in Tonnes Per Year
| Location | CO2 Emissions | CO2 Emissions Per Capita | CO2 Emissions Intensity |
|---|---|---|---|
| Pasvalys | 66,947 tn | 8.13 tn | 12,455.2 tons/km² |
| Panevėžys County | 1,859,408 tn | 8.09 tn | 235.8 tons/km² |
| Lithuania | 23,559,934 tn | 8.18 tn | 361 tons/km² |
| 2013 CO2 emissions (tonnes/year) | 66,947 tn |
| 2013 CO2 emissions (tonnes/year) per capita | 8.13 tn |
| 2013 CO2 emissions intensity (tonnes/km²/year) | 12,455.2 tons/km² |
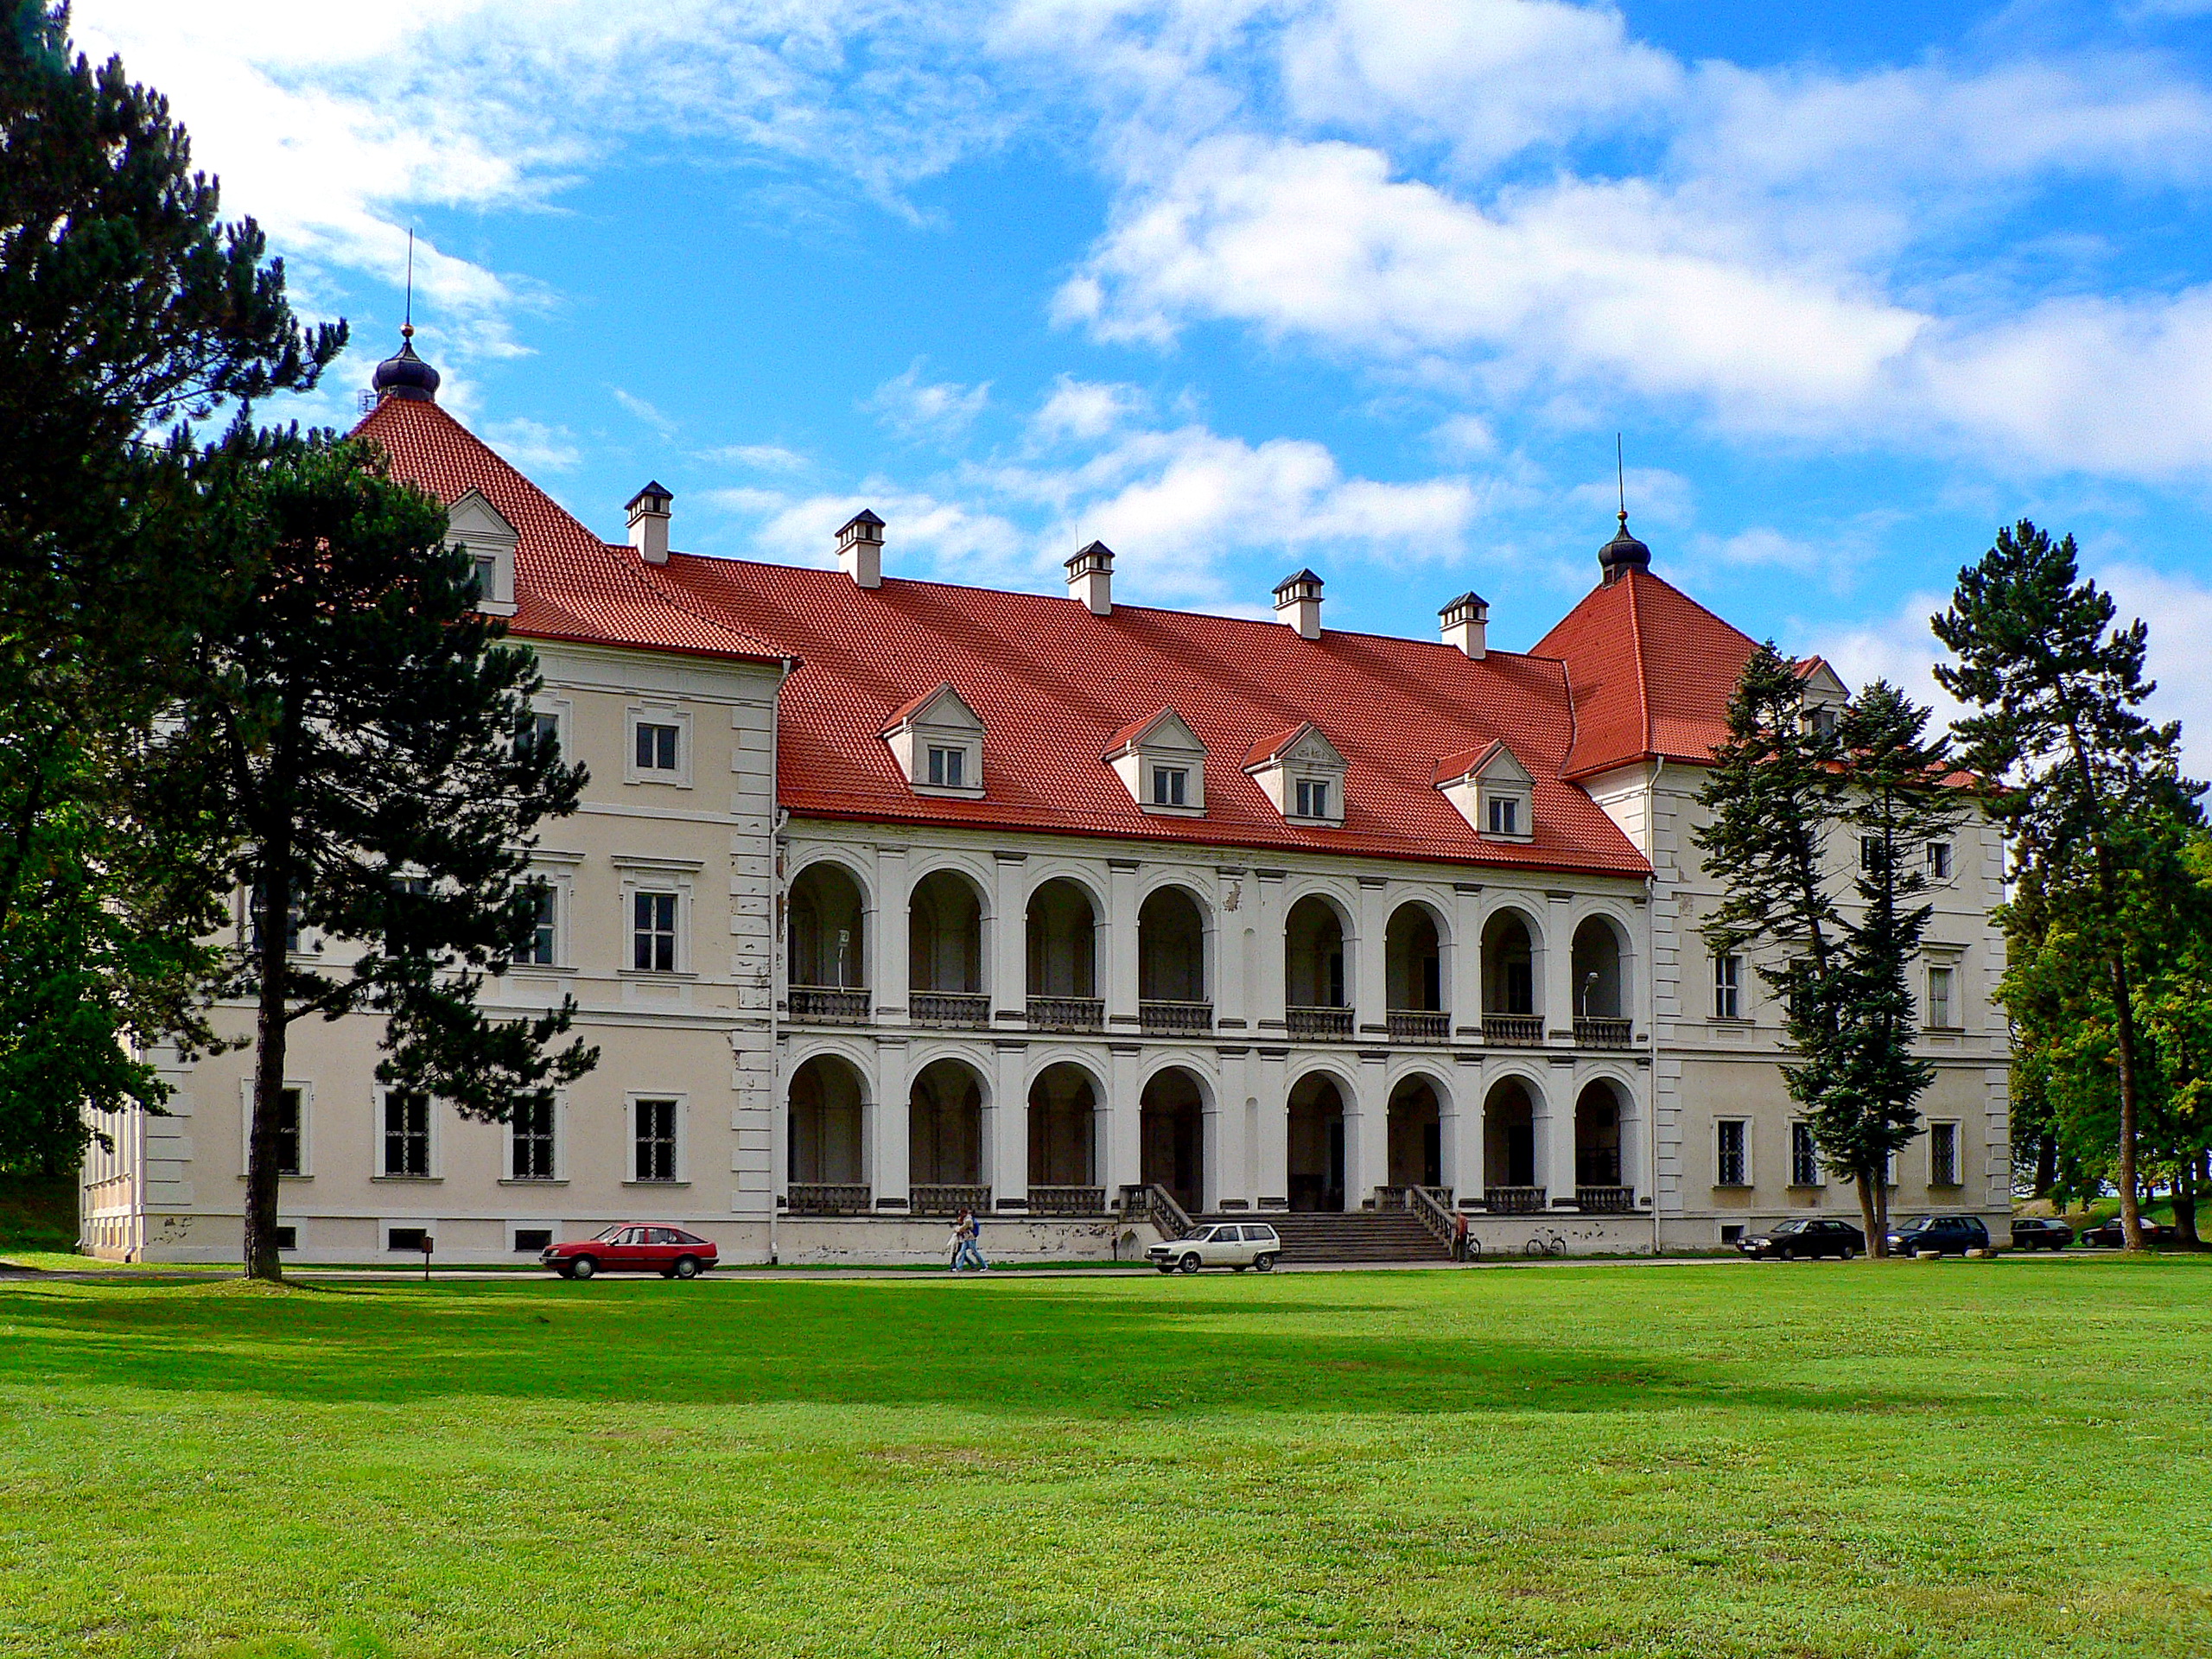
Pasvalys
Pasvalys ( pronunciation , Polish: Pozwoł) is a city in Panevėžys County, Lithuania, located near the bank of the Svalia River. Its sister city is Götene in Sweden. In 1557, the Treaty of Pozvol was signed in the town, which provoked Ivan IV of Russi..
Pasvalys Wikipedia Page


About Our Data
The data on this page is estimated using a number of publicly available tools and resources. It is provided without warranty, and could contain inaccuracies. Use at your own risk.