Categories in Zarasai
Industries
Business Distribution by Industry in Zarasai
Zarasai Facts
| Area | 5.4 km² |
| Population | 6,705 |
| Male Population | 3,238 (48.3%) |
| Female Population | 3,467 (51.7%) |
| Population change (1975 to 2020) | -59.4% |
| Population change (2000 to 2020) | -47.3% |
| Median Age | 43.7 years (Male: 41, Female: 46.2) |
| Area Codes | 385 |
| Local Time | |
| Timezone | Eastern European Summer Time |
| Lat & Lng | 55.73333, 26.25000 |
| Postal Codes | 32001, 32105, 32106, 32107, 32108, More |
Map of Zarasai
Interactive Map
Zarasai Population
Years 1975 to 2020
| Data | 1975 | 1990 | 2000 | 2015 | 2020 |
|---|---|---|---|---|---|
| Population | 16,534 | 15,338 | 12,725 | 7,090 | 6,705 |
| Population Density | 3,076.1 / km² | 2,853.6 / km² | 2,367.4 / km² | 1,319.1 / km² | 1,247.4 / km² |
Zarasai Population change from 2000 to 2015
Decrease of 44.3% from year 2000 to 2015
| Location | Change since 1975 | Change since 1990 | Change since 2000 |
|---|---|---|---|
| Zarasai | -57.1% | -53.8% | -44.3% |
| Lithuania | -12.8% | -22.2% | -17.4% |
Zarasai Median Age
Median Age: 43.7 years
| Location | Median Age | Median Age (Female) | Median Age (Male) |
|---|---|---|---|
| Zarasai | 43.7 yrs | 46.2 yrs | 41 yrs |
| Lithuania | 39.7 yrs | 42.1 yrs | 37 yrs |
Zarasai Population Density
Population Density: 1,247 / km²
| Location | Population | Area | Density |
|---|---|---|---|
| Zarasai | 6,705 | 5.4 km² | 1,247 / km² |
| Lithuania | 2.9 million | 65,263.1 km² | 44.1 / km² |
Zarasai Historical and Projected Population
Estimated Population from 0 to 2100
- JRC (European Commission's Joint Research Centre) work on the GHS built-up grid
- CIESIN (Center for International Earth Science Information Network)
- [Link] Klein Goldewijk, K., Beusen, A., Doelman, J., and Stehfest, E.: Anthropogenic land use estimates for the Holocene – HYDE 3.2, Earth Syst. Sci. Data, 9, 927–953, https://doi.org/10.5194/essd-9-927-2017, 2017.
Area Codes
Percentage Area Codes used by businesses in Zarasai
Postal Codes
Percentage of businesses by Postal Codes in Zarasai
Price Distribution
Business distribution by price for Zarasai
Human Development Index (HDI)
Statistic composite index of life expectancy, education, and per capita income.
Zarasai CO2 Emissions
Carbon Dioxide (CO2) Emissions Per Capita in Tonnes Per Year
| Location | CO2 Emissions | CO2 Emissions Per Capita | CO2 Emissions Intensity |
|---|---|---|---|
| Zarasai | 52,538 tn | 7.84 tn | 9,774.5 tons/km² |
| Lithuania | 23,559,934 tn | 8.18 tn | 361 tons/km² |
| 2013 CO2 emissions (tonnes/year) | 52,538 tn |
| 2013 CO2 emissions (tonnes/year) per capita | 7.84 tn |
| 2013 CO2 emissions intensity (tonnes/km²/year) | 9,774.5 tons/km² |
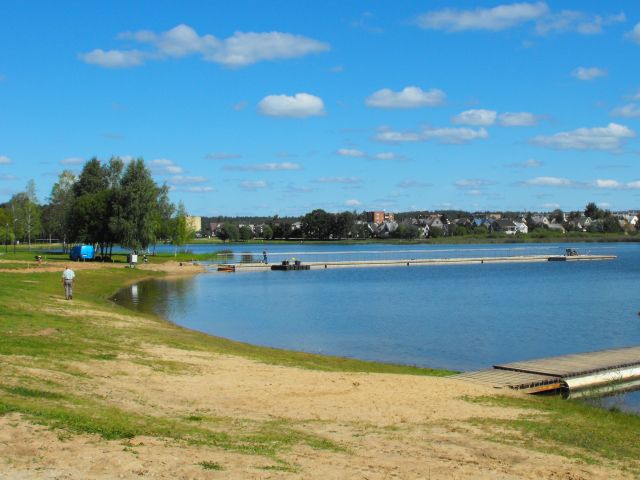
Zarasai
Zarasai ( pronunciation ) is a city in northeastern Lithuania, surrounded by many lakes and rivers: to the southwest of the city is Lake Zarasas, to the north – Lake Zarasaitis, to the southeast – Lake Baltas, and the east – Lake Griežtas. Lakes Zara..
Zarasai Wikipedia Page


About Our Data
The data on this page is estimated using a number of publicly available tools and resources. It is provided without warranty, and could contain inaccuracies. Use at your own risk.