Kangaba Facts
| Area | 4044.5 km² |
| Population | 121,191 |
| Male Population | 59,991 (49.5%) |
| Female Population | 61,200 (50.5%) |
| Population change (1975 to 2020) | +112.6% |
| Population change (2000 to 2020) | +46.3% |
| Median Age | 15.4 years (Male: 14.7, Female: 16.1) |
| Local Time | |
| Timezone | Greenwich Mean Time |
| Lat & Lng | 11.93333, -8.41667 |
Map of Kangaba
Interactive Map
Kangaba Population
Years 1975 to 2020
| Data | 1975 | 1990 | 2000 | 2015 | 2020 |
|---|---|---|---|---|---|
| Population | 56,993 | 70,076 | 82,845 | 106,570 | 121,191 |
| Population Density | 14.1 / km² | 17.3 / km² | 20.5 / km² | 26.3 / km² | 30 / km² |
Kangaba Population change from 2000 to 2015
Increase of 28.6% from year 2000 to 2015
| Location | Change since 1975 | Change since 1990 | Change since 2000 |
|---|---|---|---|
| Kangaba | +87% | +52.1% | +28.6% |
| Koulikoro Region | +201.6% | +125.4% | +72.2% |
| Mali | +173.2% | +108.4% | +59.6% |
Kangaba Median Age
Median Age: 15.4 years
| Location | Median Age | Median Age (Female) | Median Age (Male) |
|---|---|---|---|
| Kangaba | 15.4 yrs | 16.1 yrs | 14.7 yrs |
| Koulikoro Region | 15.5 yrs | 16.2 yrs | 14.8 yrs |
| Mali | 16.1 yrs | 16.6 yrs | 15.5 yrs |
Kangaba Population Density
Population Density: 30 / km²
| Location | Population | Area | Density |
|---|---|---|---|
| Kangaba | 121,191 | 4,044.5 km² | 30 / km² |
| Koulikoro Region | 3.1 million | 90,543 km² | 34.1 / km² |
| Mali | 17.7 million | 1,252,394 km² | 14.1 / km² |
Kangaba Historical and Projected Population
Estimated Population from 0 to 2100
- JRC (European Commission's Joint Research Centre) work on the GHS built-up grid
- CIESIN (Center for International Earth Science Information Network)
- [Link] Klein Goldewijk, K., Beusen, A., Doelman, J., and Stehfest, E.: Anthropogenic land use estimates for the Holocene – HYDE 3.2, Earth Syst. Sci. Data, 9, 927–953, https://doi.org/10.5194/essd-9-927-2017, 2017.
Human Development Index (HDI)
Statistic composite index of life expectancy, education, and per capita income.
Kangaba CO2 Emissions
Carbon Dioxide (CO2) Emissions Per Capita in Tonnes Per Year
| Location | CO2 Emissions | CO2 Emissions Per Capita | CO2 Emissions Intensity |
|---|---|---|---|
| Kangaba | 17,095 tn | 0.14 tn | 4.2 tons/km² |
| Koulikoro Region | 425,581 tn | 0.14 tn | 4.7 tons/km² |
| Mali | 2,464,946 tn | 0.14 tn | 2 tons/km² |
| 2013 CO2 emissions (tonnes/year) | 17,095 tn |
| 2013 CO2 emissions (tonnes/year) per capita | 0.14 tn |
| 2013 CO2 emissions intensity (tonnes/km²/year) | 4.2 tons/km² |
Natural Hazards Risk
Relative risk out of 10
| Hazard | Risk Level |
|---|---|
| Drought | Low (2) |
* Risk, particularly concerning flood or landslide, may not be for the entire area.
- Dilley, M., R.S. Chen, U. Deichmann, A.L. Lerner-Lam, M. Arnold, J. Agwe, P. Buys, O. Kjekstad, B. Lyon, and G. Yetman. 2005. Natural Disaster Hotspots: A Global Risk Analysis. Washington, D.C.: World Bank. https://doi.org/10.1596/0-8213-5930-4.
- Center for Hazards and Risk Research - CHRR - Columbia University, Center for International Earth Science Information Network - CIESIN - Columbia University, and International Research Institute for Climate and Society - IRI - Columbia University. 2005. Global Drought Hazard Frequency and Distribution. Palisades, NY: NASA Socioeconomic Data and Applications Center (SEDAC). https://doi.org/10.7927/H4VX0DFT.
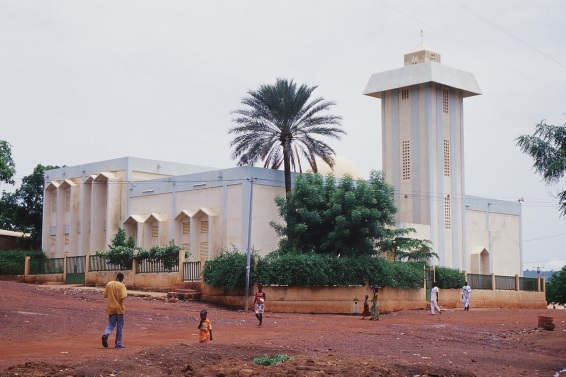
Kangaba
Kangaba is a town and commune and seat of the Cercle of Kangaba in the Koulikoro Region of south-western Mali. area was once the Kangaba Province under the Mali Empire. , a circular brick building with a conical-shaped roof, exists in a bara, or lar..
Kangaba Wikipedia Page


About Our Data
The data on this page is estimated using a number of publicly available tools and resources. It is provided without warranty, and could contain inaccuracies. Use at your own risk.