Categories in Myingyan
Industries
Business Distribution by Industry in Myingyan
| Industry Description | Number of Establishments |
|---|---|
| Restaurants | 74 |
| Shopping | 73 |
| Religion | 49 |
| Clothing stores | 43 |
| Education | 38 |
| Cafes | 37 |
| Electronics stores | 25 |
| Buddhist temple | 23 |
| Gas station | 21 |
| Other accommodation | 17 |
Myingyan Facts
| Area | 6.9 km² |
| Population | 86,453 |
| Male Population | 38,859 (44.9%) |
| Female Population | 47,594 (55.1%) |
| Population change (1975 to 2020) | +765.4% |
| Population change (2000 to 2020) | +6.6% |
| Median Age | 30.1 years (Male: 28.2, Female: 31.5) |
| Area Codes | 66 |
| Local Time | |
| Timezone | Myanmar Time |
| Lat & Lng | 21.46002, 95.38840 |
Map of Myingyan
Interactive Map
Myingyan Population
Years 1975 to 2020
| Data | 1975 | 1990 | 2000 | 2015 | 2020 |
|---|---|---|---|---|---|
| Population | 9,990 | 54,148 | 81,123 | 84,103 | 86,453 |
| Population Density | 1,453.1 / km² | 7,876.1 / km² | 11,799.7 / km² | 12,233.2 / km² | 12,575 / km² |
Myingyan Population change from 2000 to 2015
Increase of 3.7% from year 2000 to 2015
| Location | Change since 1975 | Change since 1990 | Change since 2000 |
|---|---|---|---|
| Myingyan | +741.9% | +55.3% | +3.7% |
| Mandalay Region | +947.6% | +87.1% | +16% |
| Myanmar | +73.5% | +27.5% | +12.8% |
Myingyan Median Age
Median Age: 30.1 years
| Location | Median Age | Median Age (Female) | Median Age (Male) |
|---|---|---|---|
| Myingyan | 30.1 yrs | 31.5 yrs | 28.2 yrs |
| Mandalay Region | 28.2 yrs | 29.5 yrs | 26.8 yrs |
| Myanmar | 27.2 yrs | 28.2 yrs | 26.1 yrs |
Myingyan Population Density
Population Density: 12,575 / km²
| Location | Population | Area | Density |
|---|---|---|---|
| Myingyan | 86,453 | 6.9 km² | 12,575 / km² |
| Mandalay Region | 6.6 million | 30,955.3 km² | 213 / km² |
| Myanmar | 53.1 million | 668,905 km² | 79.4 / km² |
Myingyan Historical and Projected Population
Estimated Population from 1870 to 2100
- JRC (European Commission's Joint Research Centre) work on the GHS built-up grid
- CIESIN (Center for International Earth Science Information Network)
- [Link] Klein Goldewijk, K., Beusen, A., Doelman, J., and Stehfest, E.: Anthropogenic land use estimates for the Holocene – HYDE 3.2, Earth Syst. Sci. Data, 9, 927–953, https://doi.org/10.5194/essd-9-927-2017, 2017.
Area Codes
Percentage Area Codes used by businesses in Myingyan
Human Development Index (HDI)
Statistic composite index of life expectancy, education, and per capita income.
Myingyan CO2 Emissions
Carbon Dioxide (CO2) Emissions Per Capita in Tonnes Per Year
| Location | CO2 Emissions | CO2 Emissions Per Capita | CO2 Emissions Intensity |
|---|---|---|---|
| Myingyan | 24,116 tn | 0.28 tn | 3,507.9 tons/km² |
| Mandalay Region | 1,748,349 tn | 0.27 tn | 56.5 tons/km² |
| Myanmar | 11,664,181 tn | 0.22 tn | 17.4 tons/km² |
| 2013 CO2 emissions (tonnes/year) | 24,116 tn |
| 2013 CO2 emissions (tonnes/year) per capita | 0.28 tn |
| 2013 CO2 emissions intensity (tonnes/km²/year) | 3,507.9 tons/km² |
Natural Hazards Risk
Relative risk out of 10
| Hazard | Risk Level |
|---|---|
| Drought | High (8) |
| Flood | Medium (4) |
| Earthquake | High (8) |
* Risk, particularly concerning flood or landslide, may not be for the entire area.
- Dilley, M., R.S. Chen, U. Deichmann, A.L. Lerner-Lam, M. Arnold, J. Agwe, P. Buys, O. Kjekstad, B. Lyon, and G. Yetman. 2005. Natural Disaster Hotspots: A Global Risk Analysis. Washington, D.C.: World Bank. https://doi.org/10.1596/0-8213-5930-4.
- Center for Hazards and Risk Research - CHRR - Columbia University, Center for International Earth Science Information Network - CIESIN - Columbia University, and International Research Institute for Climate and Society - IRI - Columbia University. 2005. Global Drought Hazard Frequency and Distribution. Palisades, NY: NASA Socioeconomic Data and Applications Center (SEDAC). https://doi.org/10.7927/H4VX0DFT.
- Center for Hazards and Risk Research - CHRR - Columbia University, Center for International Earth Science Information Network - CIESIN - Columbia University. 2005. Global Flood Hazard Frequency and Distribution. Palisades, NY: NASA Socioeconomic Data and Applications Center (SEDAC). https://doi.org/10.7927/H4668B3D.
- Center for Hazards and Risk Research - CHRR - Columbia University, Center for International Earth Science Information Network - CIESIN - Columbia University. 2005. Global Earthquake Hazard Distribution - Peak Ground Acceleration. Palisades, NY: NASA Socioeconomic Data and Applications Center (SEDAC). https://doi.org/10.7927/H4BZ63ZS.
Recent Nearby Earthquakes
Magnitude 3.0 and greater
| Date▼ | Time↕ | Magnitude↕ | Distance↕ | Depth↕ | Location↕ | Link |
|---|---|---|---|---|---|---|
| 6/26/18 | 12:02 AM | 4.6 | 90.7 km | 21,810 m | 14km NW of Monywa, Burma | usgs.gov |
| 4/27/18 | 3:18 AM | 4.3 | 70.6 km | 124,720 m | 44km SW of Monywa, Burma | usgs.gov |
| 3/24/18 | 6:41 PM | 4.2 | 72.5 km | 118,820 m | 51km SW of Monywa, Burma | usgs.gov |
| 11/4/17 | 8:29 PM | 4.3 | 46.5 km | 34,870 m | 41km W of Sagaing, Burma | usgs.gov |
| 10/2/17 | 6:13 PM | 4.6 | 87.8 km | 95,120 m | 59km WNW of Pakokku, Burma | usgs.gov |
| 9/17/17 | 9:49 PM | 4.5 | 87.4 km | 97,030 m | 65km NW of Pakokku, Burma | usgs.gov |
| 8/24/16 | 10:57 AM | 4.5 | 94.9 km | 93,150 m | 16km WNW of Chauk, Burma | usgs.gov |
| 8/1/16 | 10:01 AM | 5.1 | 50.3 km | 131,470 m | 17km W of Pakokku, Burma | usgs.gov |
| 7/27/16 | 4:20 AM | 4.9 | 85 km | 96,840 m | 58km WNW of Pakokku, Burma | usgs.gov |
| 3/7/16 | 3:13 AM | 4.6 | 65.2 km | 100,990 m | 24km ENE of Chauk, Burma | usgs.gov |
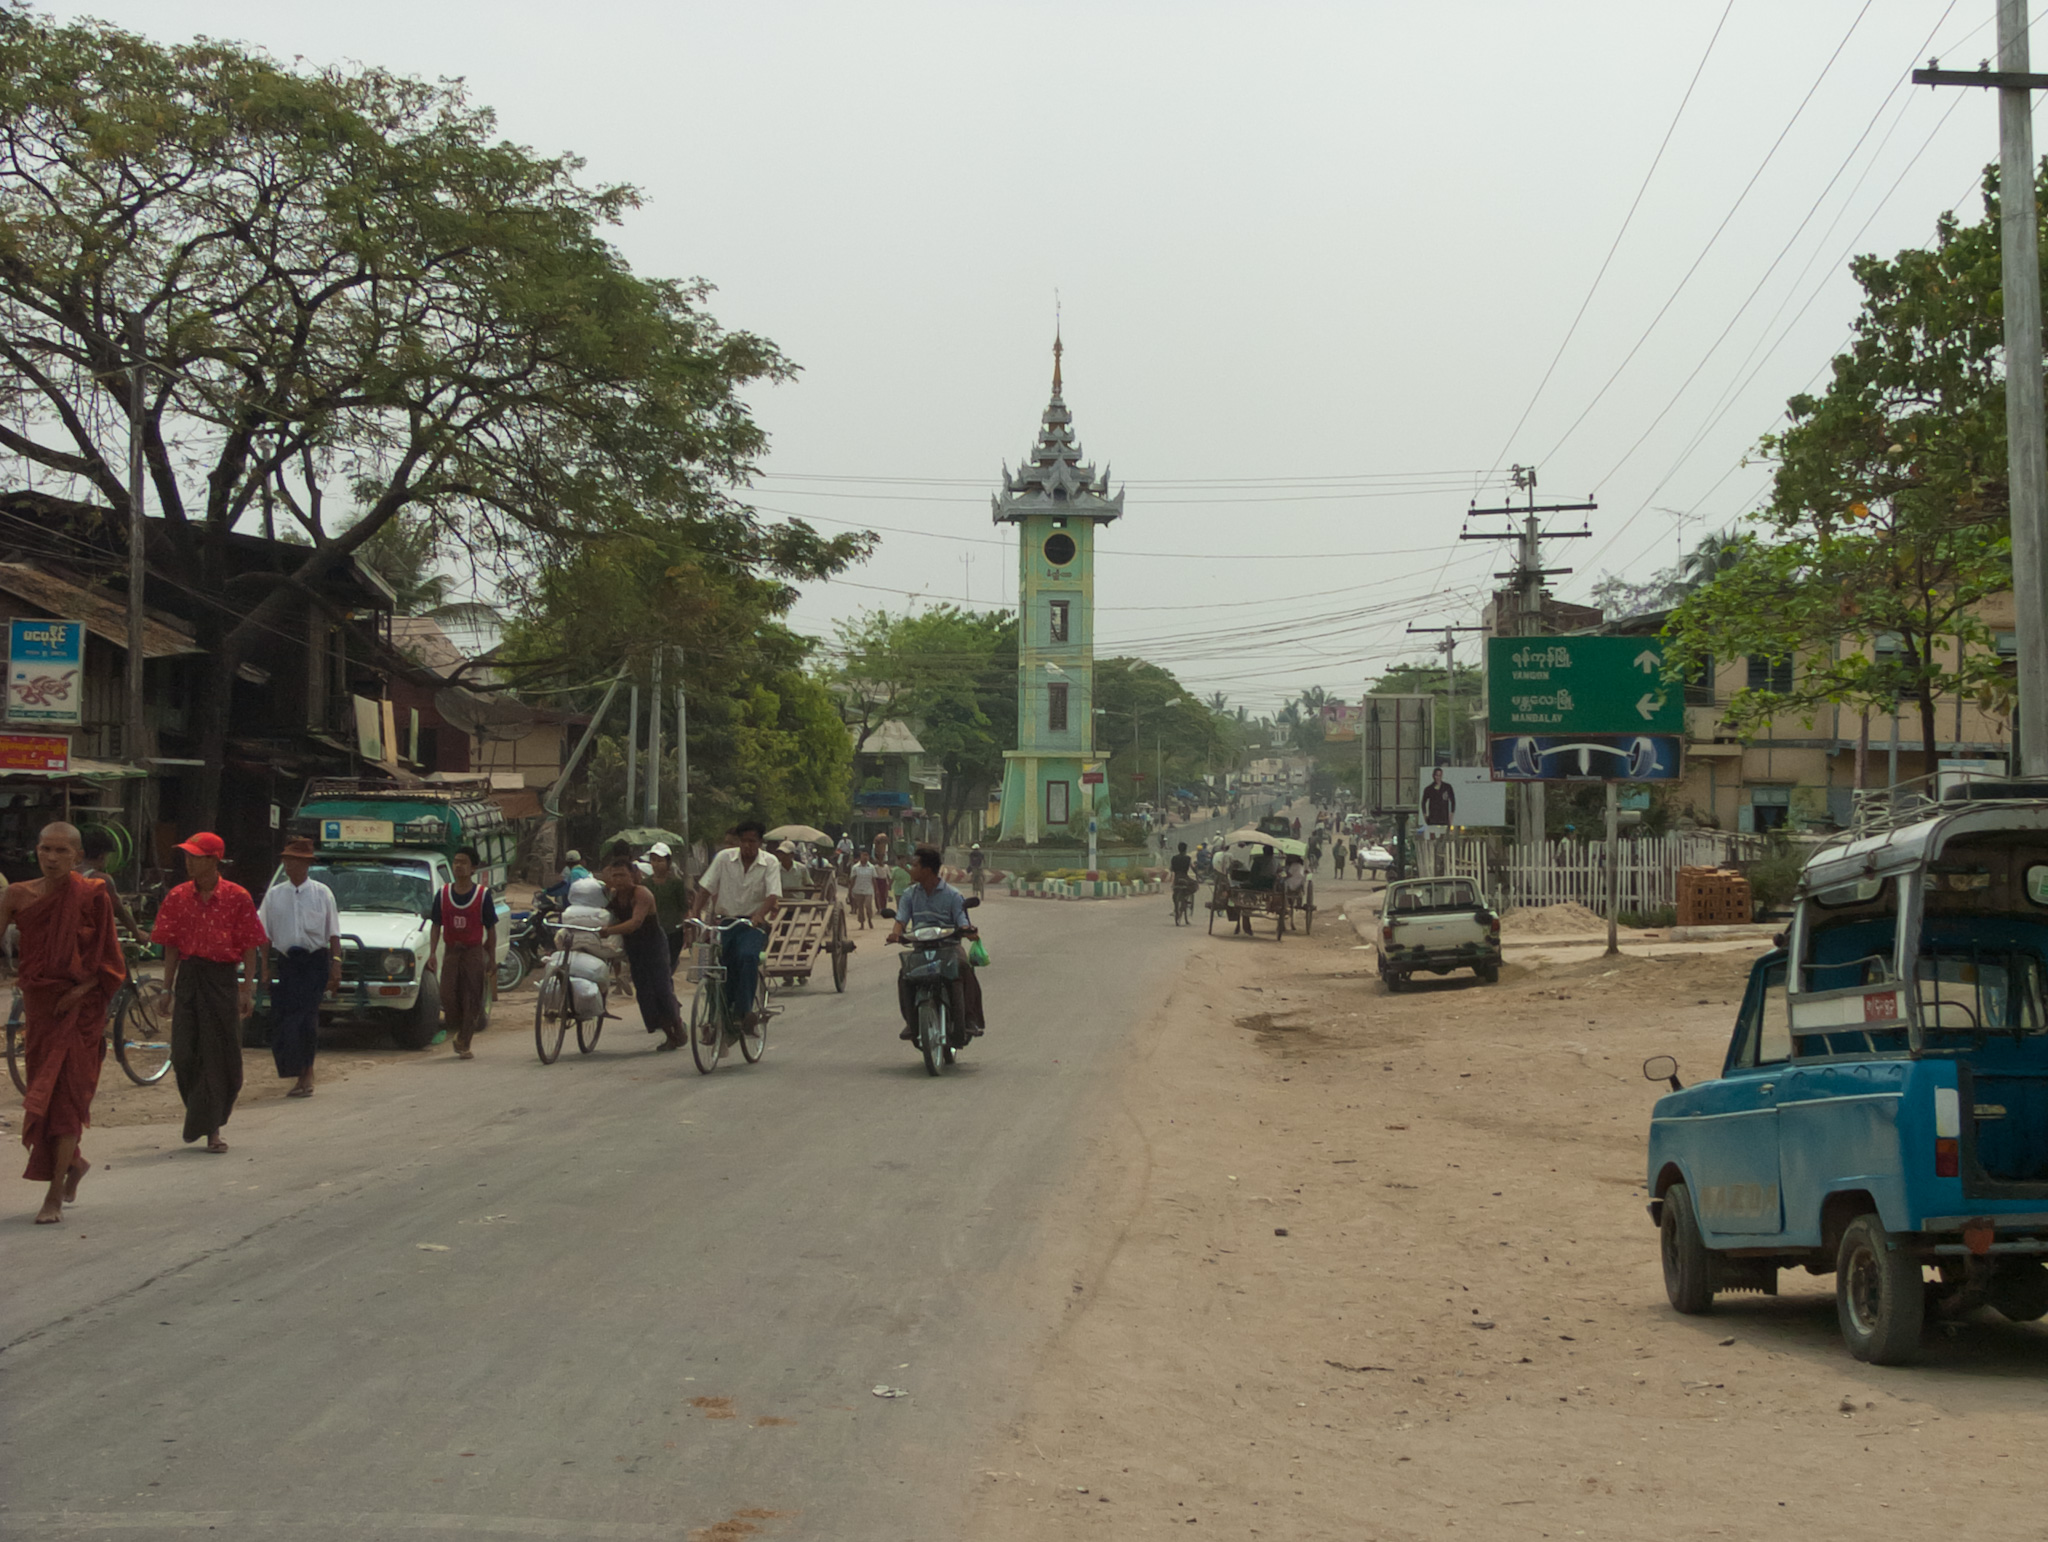
Myingyan
Myingyan is a city and district in the Mandalay Division of central Myanmar, previously, it was a district in the Meiktila Division of Upper Burma. It is currently the capital of Myingyan Township and lies along the National Highway 2. As of 2002, th..
Myingyan Wikipedia Page

About Our Data
The data on this page is estimated using a number of publicly available tools and resources. It is provided without warranty, and could contain inaccuracies. Use at your own risk.