Categories in Atolinga
Industries
Business Distribution by Industry in Atolinga
| Industry Description | Number of Establishments |
|---|---|
| Grocery stores and supermarkets | 8 |
| Education | 6 |
| Public administration | 6 |
Atolinga Facts
| Area | 1.9 km² |
| Population | 1,689 |
| Male Population | 777 (46.0%) |
| Female Population | 912 (54.0%) |
| Population change (1975 to 2020) | +10.9% |
| Population change (2000 to 2020) | -4.7% |
| Median Age | 28.5 years (Male: 28.9, Female: 28.1) |
| Area Codes | 346 |
| Neighborhoods | Atolinga, Centro |
| Local Time | |
| Timezone | Central Standard Time |
| Lat & Lng | 21.73333, -103.46667 |
| Postal Codes | 99730, 99733, 99734, 99736 |
Map of Atolinga
Interactive Map
Atolinga Population
Years 1975 to 2020
| Data | 1975 | 1990 | 2000 | 2015 | 2020 |
|---|---|---|---|---|---|
| Population | 1,523 | 1,758 | 1,772 | 1,609 | 1,689 |
| Population Density | 812.3 / km² | 937.6 / km² | 945.1 / km² | 858.1 / km² | 900.8 / km² |
Atolinga Population change from 2000 to 2015
Decrease of 9.2% from year 2000 to 2015
| Location | Change since 1975 | Change since 1990 | Change since 2000 |
|---|---|---|---|
| Atolinga | +5.6% | -8.5% | -9.2% |
| Zacatecas | +125.5% | +51.9% | +23.7% |
| Mexico | +108.7% | +48.4% | +23.5% |
Atolinga Median Age
Median Age: 28.5 years
| Location | Median Age | Median Age (Female) | Median Age (Male) |
|---|---|---|---|
| Atolinga | 28.5 yrs | 28.1 yrs | 28.9 yrs |
| Zacatecas | 25.1 yrs | 25.8 yrs | 24.3 yrs |
| Mexico | 26.2 yrs | 27 yrs | 25.3 yrs |
Atolinga Population Density
Population Density: 901 / km²
| Location | Population | Area | Density |
|---|---|---|---|
| Atolinga | 1,689 | 1.875 km² | 901 / km² |
| Zacatecas | 1.7 million | 75,275.4 km² | 22.3 / km² |
| Mexico | 126.8 million | 1,965,208 km² | 64.5 / km² |
Atolinga Historical and Projected Population
Estimated Population from 0 to 2100
- JRC (European Commission's Joint Research Centre) work on the GHS built-up grid
- CIESIN (Center for International Earth Science Information Network)
- [Link] Klein Goldewijk, K., Beusen, A., Doelman, J., and Stehfest, E.: Anthropogenic land use estimates for the Holocene – HYDE 3.2, Earth Syst. Sci. Data, 9, 927–953, https://doi.org/10.5194/essd-9-927-2017, 2017.
Human Development Index (HDI)
Statistic composite index of life expectancy, education, and per capita income.
Atolinga CO2 Emissions
Carbon Dioxide (CO2) Emissions Per Capita in Tonnes Per Year
| Location | CO2 Emissions | CO2 Emissions Per Capita | CO2 Emissions Intensity |
|---|---|---|---|
| Atolinga | 5,948 tn | 3.52 tn | 3,172.2 tons/km² |
| Zacatecas | 5,919,877 tn | 3.53 tn | 78.6 tons/km² |
| Mexico | 496,865,013 tn | 3.92 tn | 252.8 tons/km² |
| 2013 CO2 emissions (tonnes/year) | 5,948 tn |
| 2013 CO2 emissions (tonnes/year) per capita | 3.52 tn |
| 2013 CO2 emissions intensity (tonnes/km²/year) | 3,172.2 tons/km² |
Natural Hazards Risk
Relative risk out of 10
| Hazard | Risk Level |
|---|---|
| Drought | Medium (5) |
| Earthquake | Medium (4) |
| Cyclone | Medium (5) |
* Risk, particularly concerning flood or landslide, may not be for the entire area.
- Dilley, M., R.S. Chen, U. Deichmann, A.L. Lerner-Lam, M. Arnold, J. Agwe, P. Buys, O. Kjekstad, B. Lyon, and G. Yetman. 2005. Natural Disaster Hotspots: A Global Risk Analysis. Washington, D.C.: World Bank. https://doi.org/10.1596/0-8213-5930-4.
- Center for Hazards and Risk Research - CHRR - Columbia University, Center for International Earth Science Information Network - CIESIN - Columbia University, International Bank for Reconstruction and Development - The World Bank, and United Nations Environment Programme Global Resource Information Database Geneva - UNEP/GRID-Geneva. 2005. Global Cyclone Hazard Frequency and Distribution. Palisades, NY: NASA Socioeconomic Data and Applications Center (SEDAC). https://doi.org/10.7927/H4CZ353K.
- Center for Hazards and Risk Research - CHRR - Columbia University, Center for International Earth Science Information Network - CIESIN - Columbia University, and International Research Institute for Climate and Society - IRI - Columbia University. 2005. Global Drought Hazard Frequency and Distribution. Palisades, NY: NASA Socioeconomic Data and Applications Center (SEDAC). https://doi.org/10.7927/H4VX0DFT.
- Center for Hazards and Risk Research - CHRR - Columbia University, Center for International Earth Science Information Network - CIESIN - Columbia University. 2005. Global Earthquake Hazard Distribution - Peak Ground Acceleration. Palisades, NY: NASA Socioeconomic Data and Applications Center (SEDAC). https://doi.org/10.7927/H4BZ63ZS.
Recent Nearby Earthquakes
Magnitude 3.0 and greater
| Date▼ | Time↕ | Magnitude↕ | Distance↕ | Depth↕ | Location↕ | Link |
|---|---|---|---|---|---|---|
| 12/17/15 | 7:59 AM | 3.6 | 98.5 km | 6,700 m | 7km NNW of Tesistan, Mexico | usgs.gov |
| 12/15/15 | 5:49 PM | 3.9 | 88 km | 10,000 m | 15km WNW of Ixtlahuacan del Rio, Mexico | usgs.gov |
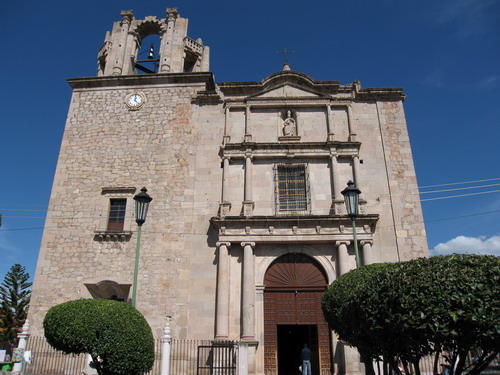
Atolinga
Atolinga is the seat of Atolinga Municipality in the Mexican state of Zacatecas, located in its southwestern portion. coordinates of the municipal seat of Atolinga are 21° 44’ 15” north and 103° 28’ 30” west. The town is located at 2,250 meters abov..
Atolinga Wikipedia Page


About Our Data
The data on this page is estimated using a number of publicly available tools and resources. It is provided without warranty, and could contain inaccuracies. Use at your own risk.