Categories in Jocotepec
Industries
Business Distribution by Industry in Jocotepec
| Industry Description | Number of Establishments |
|---|---|
| Restaurants | 153 |
| Shopping | 92 |
| Grocery stores and supermarkets | 79 |
| Education | 48 |
| Bars, pubs and taverns | 35 |
| Public administration | 35 |
| Corporate management | 35 |
| Health and medical | 34 |
| Other accommodation | 33 |
| Apartments | 33 |
| Car repair | 32 |
| Wine, beer and liquor stores | 31 |
| Pharmacies and drug stores | 27 |
Jocotepec Facts
| Area | 5.8 km² |
| Population | 22,491 |
| Male Population | 11,126 (49.5%) |
| Female Population | 11,365 (50.5%) |
| Population change (1975 to 2020) | +188.4% |
| Population change (2000 to 2020) | +36.8% |
| Median Age | 24.6 years (Male: 23.7, Female: 25.5) |
| Area Codes | 346, 467 |
| Neighborhoods | Jocotepec Centro, Centro, Sin Nombre, Nextipac, El Crucero |
| Local Time | |
| Timezone | Central Standard Time |
| Lat & Lng | 20.28527, -103.42897 |
| Postal Codes | 45800, 45802, 45803, 45804, 45805, More |
Map of Jocotepec
Interactive Map
Jocotepec Population
Years 1975 to 2020
| Data | 1975 | 1990 | 2000 | 2015 | 2020 |
|---|---|---|---|---|---|
| Population | 7,799 | 12,722 | 16,437 | 21,501 | 22,491 |
| Population Density | 1,356.3 / km² | 2,212.5 / km² | 2,858.6 / km² | 3,739.3 / km² | 3,911.5 / km² |
Jocotepec Population change from 2000 to 2015
Increase of 30.8% from year 2000 to 2015
| Location | Change since 1975 | Change since 1990 | Change since 2000 |
|---|---|---|---|
| Jocotepec | +175.7% | +69% | +30.8% |
| Jalisco | +84.6% | +43.3% | +24.1% |
| Mexico | +108.7% | +48.4% | +23.5% |
Jocotepec Median Age
Median Age: 24.6 years
| Location | Median Age | Median Age (Female) | Median Age (Male) |
|---|---|---|---|
| Jocotepec | 24.6 yrs | 25.5 yrs | 23.7 yrs |
| Jalisco | 25.9 yrs | 26.8 yrs | 25.1 yrs |
| Mexico | 26.2 yrs | 27 yrs | 25.3 yrs |
Jocotepec Population Density
Population Density: 3,912 / km²
| Location | Population | Area | Density |
|---|---|---|---|
| Jocotepec | 22,491 | 5.8 km² | 3,912 / km² |
| Jalisco | 8.4 million | 78,597.4 km² | 107 / km² |
| Mexico | 126.8 million | 1,965,208 km² | 64.5 / km² |
Jocotepec Historical and Projected Population
Estimated Population from 0 to 2100
- JRC (European Commission's Joint Research Centre) work on the GHS built-up grid
- CIESIN (Center for International Earth Science Information Network)
- [Link] Klein Goldewijk, K., Beusen, A., Doelman, J., and Stehfest, E.: Anthropogenic land use estimates for the Holocene – HYDE 3.2, Earth Syst. Sci. Data, 9, 927–953, https://doi.org/10.5194/essd-9-927-2017, 2017.
Neighborhoods in Jocotepec
Percentage of businesses by neighborhood in Jocotepec
Price Distribution
Business distribution by price for Jocotepec
Human Development Index (HDI)
Statistic composite index of life expectancy, education, and per capita income.
Jocotepec CO2 Emissions
Carbon Dioxide (CO2) Emissions Per Capita in Tonnes Per Year
| Location | CO2 Emissions | CO2 Emissions Per Capita | CO2 Emissions Intensity |
|---|---|---|---|
| Jocotepec | 93,234 tn | 4.15 tn | 16,214.6 tons/km² |
| Jalisco | 34,421,540 tn | 4.09 tn | 437.9 tons/km² |
| Mexico | 496,865,013 tn | 3.92 tn | 252.8 tons/km² |
| 2013 CO2 emissions (tonnes/year) | 93,234 tn |
| 2013 CO2 emissions (tonnes/year) per capita | 4.15 tn |
| 2013 CO2 emissions intensity (tonnes/km²/year) | 16,214.6 tons/km² |
Natural Hazards Risk
Relative risk out of 10
| Hazard | Risk Level |
|---|---|
| Drought | Medium (5) |
| Flood | Medium (4) |
| Earthquake | High (9) |
| Landslide | Medium (6) |
* Risk, particularly concerning flood or landslide, may not be for the entire area.
- Dilley, M., R.S. Chen, U. Deichmann, A.L. Lerner-Lam, M. Arnold, J. Agwe, P. Buys, O. Kjekstad, B. Lyon, and G. Yetman. 2005. Natural Disaster Hotspots: A Global Risk Analysis. Washington, D.C.: World Bank. https://doi.org/10.1596/0-8213-5930-4.
- Center for Hazards and Risk Research - CHRR - Columbia University, Center for International Earth Science Information Network - CIESIN - Columbia University, and Norwegian Geotechnical Institute - NGI. 2005. Global Landslide Hazard Distribution. Palisades, NY: NASA Socioeconomic Data and Applications Center (SEDAC). https://doi.org/10.7927/H4P848VZ.
- Center for Hazards and Risk Research - CHRR - Columbia University, Center for International Earth Science Information Network - CIESIN - Columbia University, and International Research Institute for Climate and Society - IRI - Columbia University. 2005. Global Drought Hazard Frequency and Distribution. Palisades, NY: NASA Socioeconomic Data and Applications Center (SEDAC). https://doi.org/10.7927/H4VX0DFT.
- Center for Hazards and Risk Research - CHRR - Columbia University, Center for International Earth Science Information Network - CIESIN - Columbia University. 2005. Global Flood Hazard Frequency and Distribution. Palisades, NY: NASA Socioeconomic Data and Applications Center (SEDAC). https://doi.org/10.7927/H4668B3D.
- Center for Hazards and Risk Research - CHRR - Columbia University, Center for International Earth Science Information Network - CIESIN - Columbia University. 2005. Global Earthquake Hazard Distribution - Peak Ground Acceleration. Palisades, NY: NASA Socioeconomic Data and Applications Center (SEDAC). https://doi.org/10.7927/H4BZ63ZS.
Recent Nearby Earthquakes
Magnitude 3.0 and greater
| Date▼ | Time↕ | Magnitude↕ | Distance↕ | Depth↕ | Location↕ | Link |
|---|---|---|---|---|---|---|
| 5/11/16 | 10:35 PM | 4.5 | 52 km | 10,000 m | 3km SSW of Tesistan, Mexico | usgs.gov |
| 12/17/15 | 7:59 AM | 3.6 | 62.6 km | 6,700 m | 7km NNW of Tesistan, Mexico | usgs.gov |
| 12/15/15 | 5:49 PM | 3.9 | 73 km | 10,000 m | 15km WNW of Ixtlahuacan del Rio, Mexico | usgs.gov |
| 12/15/15 | 4:09 PM | 4.1 | 55 km | 27,110 m | 6km NNW of La Venta del Astillero, Mexico | usgs.gov |
| 12/14/13 | 10:33 PM | 4.1 | 97.5 km | 104,600 m | 8km N of Suchitlan, Mexico | usgs.gov |
| 5/18/12 | 3:07 AM | 4.2 | 7.5 km | 5,000 m | Jalisco, Mexico | usgs.gov |
| 10/9/08 | 12:10 PM | 3.9 | 23.2 km | 37,200 m | Jalisco, Mexico | usgs.gov |
| 9/24/05 | 2:46 PM | 3.8 | 91.1 km | 117,100 m | Jalisco, Mexico | usgs.gov |
| 6/5/05 | 7:20 PM | 4.2 | 92.7 km | 5,200 m | Jalisco, Mexico | usgs.gov |
| 6/2/05 | 4:50 AM | 4.1 | 90.4 km | 7,000 m | Jalisco, Mexico | usgs.gov |
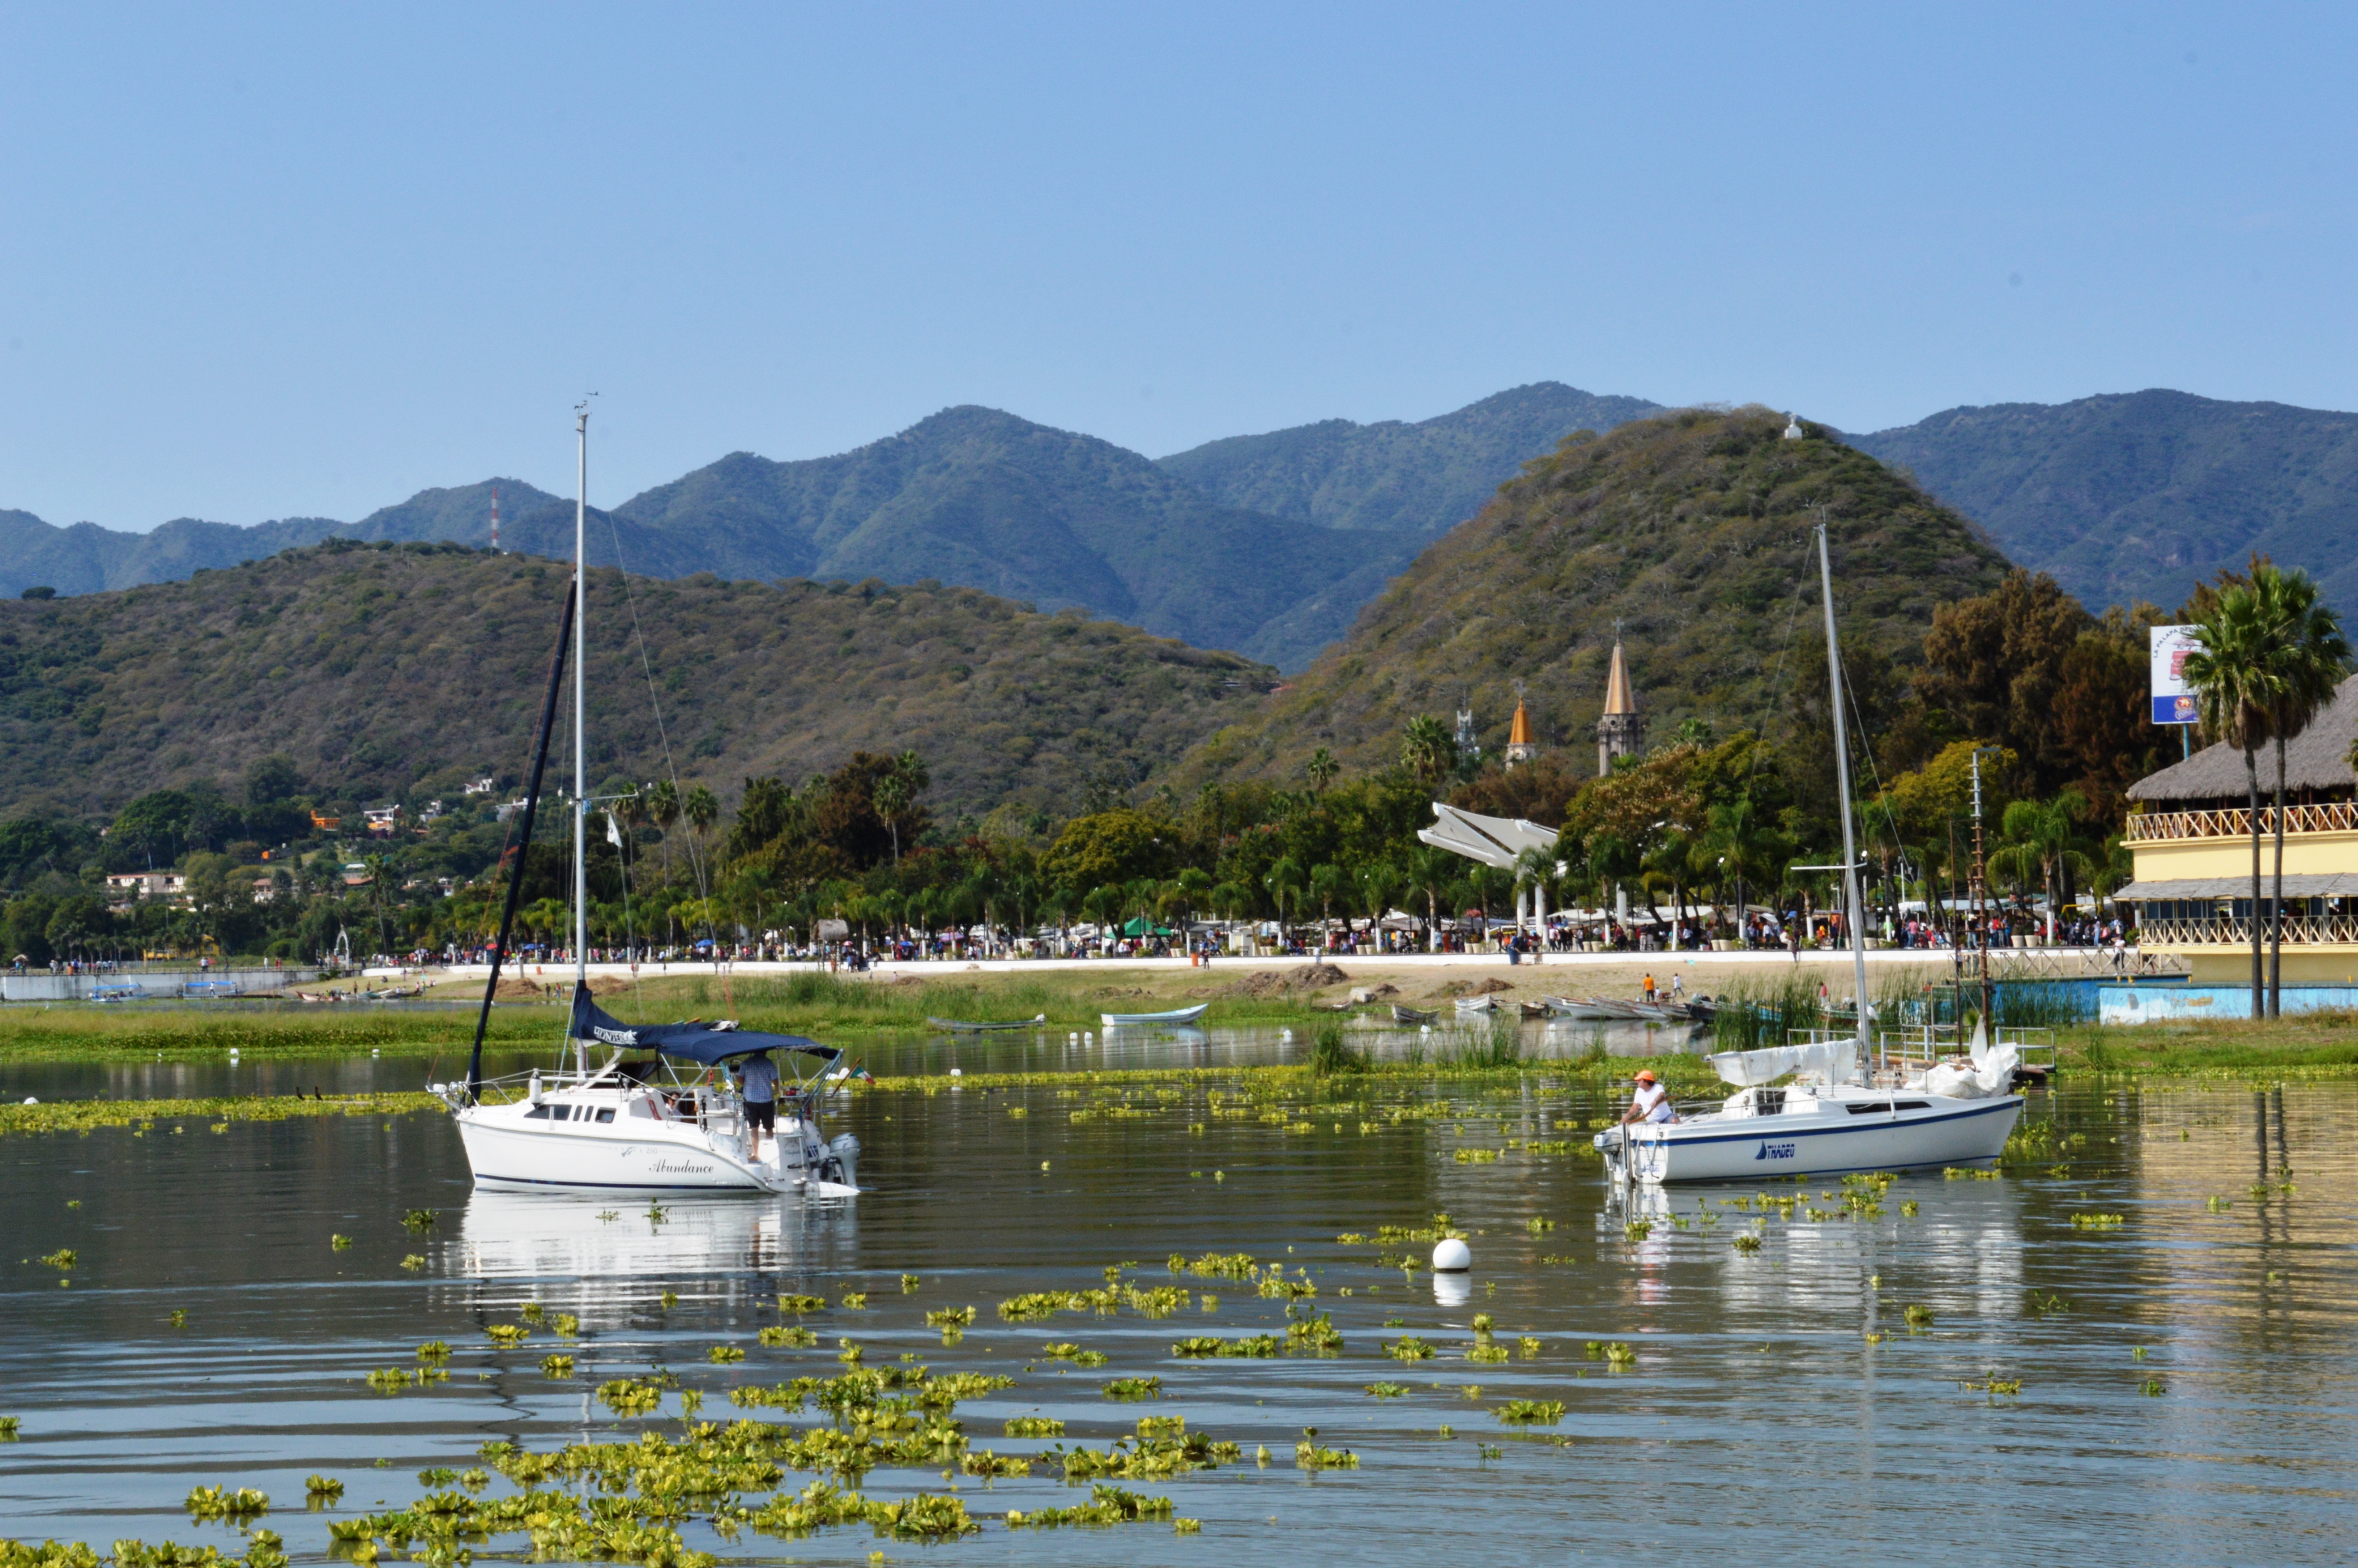
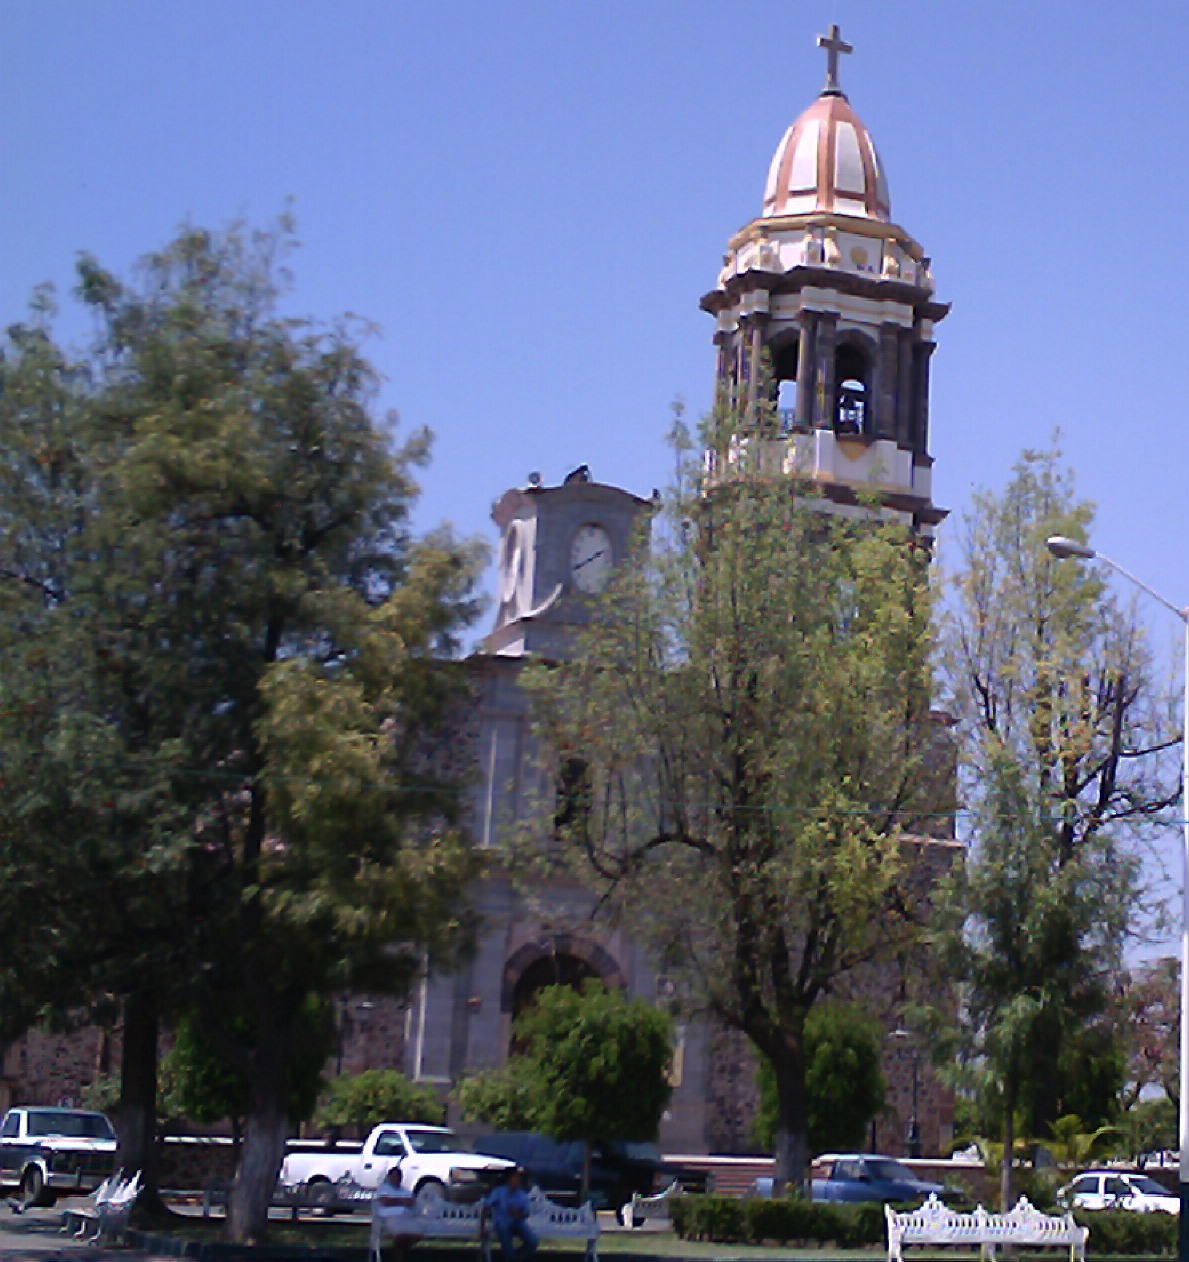
Jocotepec
Jocotepec (Spanish pronunciation: [xokoteˈpek]) is a town and municipality, in Jalisco in central-western Mexico. The municipality covers an area of 384.36 km². As of 2005, the municipality had a total population of 37,972.
Jocotepec Wikipedia Page

About Our Data
The data on this page is estimated using a number of publicly available tools and resources. It is provided without warranty, and could contain inaccuracies. Use at your own risk.