Categories in Misantla
Industries
Business Distribution by Industry in Misantla
| Industry Description | Number of Establishments |
|---|---|
| Restaurants | 123 |
| Shopping | 112 |
| Education | 83 |
| Grocery stores and supermarkets | 70 |
| Clothing stores | 44 |
| Pharmacies and drug stores | 29 |
| Bars, pubs and taverns | 25 |
| Corporate management | 25 |
| Beauty salons | 24 |
| Churches | 22 |
Misantla Facts
| Area | 7.4 km² |
| Population | 30,492 |
| Male Population | 14,656 (48.1%) |
| Female Population | 15,836 (51.9%) |
| Population change (1975 to 2020) | +84.5% |
| Population change (2000 to 2020) | +16.3% |
| Median Age | 26.8 years (Male: 25, Female: 28.3) |
| Area Codes | 467 |
| Neighborhoods | Centro, Benito Juárez, Aviacion, Veinte de Noviembre, Marco Antonio |
| Local Time | |
| Timezone | Central Standard Time |
| Lat & Lng | 19.92992, -96.85194 |
| Postal Codes | 93820, 93826, 93827, 93828, 93829, More |
Map of Misantla
Interactive Map
Misantla Population
Years 1975 to 2020
| Data | 1975 | 1990 | 2000 | 2015 | 2020 |
|---|---|---|---|---|---|
| Population | 16,527 | 22,729 | 26,209 | 28,905 | 30,492 |
| Population Density | 2,222.1 / km² | 3,056 / km² | 3,523.9 / km² | 3,886.4 / km² | 4,099.8 / km² |
Misantla Population change from 2000 to 2015
Increase of 10.3% from year 2000 to 2015
| Location | Change since 1975 | Change since 1990 | Change since 2000 |
|---|---|---|---|
| Misantla | +74.9% | +27.2% | +10.3% |
| Veracruz | +103.6% | +42.1% | +18.7% |
| Mexico | +108.7% | +48.4% | +23.5% |
Misantla Median Age
Median Age: 26.8 years
| Location | Median Age | Median Age (Female) | Median Age (Male) |
|---|---|---|---|
| Misantla | 26.8 yrs | 28.3 yrs | 25 yrs |
| Veracruz | 27.2 yrs | 28.2 yrs | 26.1 yrs |
| Mexico | 26.2 yrs | 27 yrs | 25.3 yrs |
Misantla Population Density
Population Density: 4,100 / km²
| Location | Population | Area | Density |
|---|---|---|---|
| Misantla | 30,492 | 7.4 km² | 4,100 / km² |
| Veracruz | 8.4 million | 71,823.7 km² | 117 / km² |
| Mexico | 126.8 million | 1,965,208 km² | 64.5 / km² |
Misantla Historical and Projected Population
Estimated Population from 0 to 2100
- JRC (European Commission's Joint Research Centre) work on the GHS built-up grid
- CIESIN (Center for International Earth Science Information Network)
- [Link] Klein Goldewijk, K., Beusen, A., Doelman, J., and Stehfest, E.: Anthropogenic land use estimates for the Holocene – HYDE 3.2, Earth Syst. Sci. Data, 9, 927–953, https://doi.org/10.5194/essd-9-927-2017, 2017.
Postal Codes
Percentage of businesses by Postal Codes in Misantla
Price Distribution
Business distribution by price for Misantla
Human Development Index (HDI)
Statistic composite index of life expectancy, education, and per capita income.
Misantla CO2 Emissions
Carbon Dioxide (CO2) Emissions Per Capita in Tonnes Per Year
| Location | CO2 Emissions | CO2 Emissions Per Capita | CO2 Emissions Intensity |
|---|---|---|---|
| Misantla | 114,182 tn | 3.74 tn | 15,352.2 tons/km² |
| Veracruz | 30,104,681 tn | 3.57 tn | 419.1 tons/km² |
| Mexico | 496,865,013 tn | 3.92 tn | 252.8 tons/km² |
| 2013 CO2 emissions (tonnes/year) | 114,182 tn |
| 2013 CO2 emissions (tonnes/year) per capita | 3.74 tn |
| 2013 CO2 emissions intensity (tonnes/km²/year) | 15,352.2 tons/km² |
Natural Hazards Risk
Relative risk out of 10
| Hazard | Risk Level |
|---|---|
| Drought | Low (2) |
| Flood | Medium (7) |
| Earthquake | Medium (4) |
| Landslide | Medium (7) |
* Risk, particularly concerning flood or landslide, may not be for the entire area.
- Dilley, M., R.S. Chen, U. Deichmann, A.L. Lerner-Lam, M. Arnold, J. Agwe, P. Buys, O. Kjekstad, B. Lyon, and G. Yetman. 2005. Natural Disaster Hotspots: A Global Risk Analysis. Washington, D.C.: World Bank. https://doi.org/10.1596/0-8213-5930-4.
- Center for Hazards and Risk Research - CHRR - Columbia University, Center for International Earth Science Information Network - CIESIN - Columbia University, and Norwegian Geotechnical Institute - NGI. 2005. Global Landslide Hazard Distribution. Palisades, NY: NASA Socioeconomic Data and Applications Center (SEDAC). https://doi.org/10.7927/H4P848VZ.
- Center for Hazards and Risk Research - CHRR - Columbia University, Center for International Earth Science Information Network - CIESIN - Columbia University, and International Research Institute for Climate and Society - IRI - Columbia University. 2005. Global Drought Hazard Frequency and Distribution. Palisades, NY: NASA Socioeconomic Data and Applications Center (SEDAC). https://doi.org/10.7927/H4VX0DFT.
- Center for Hazards and Risk Research - CHRR - Columbia University, Center for International Earth Science Information Network - CIESIN - Columbia University. 2005. Global Flood Hazard Frequency and Distribution. Palisades, NY: NASA Socioeconomic Data and Applications Center (SEDAC). https://doi.org/10.7927/H4668B3D.
- Center for Hazards and Risk Research - CHRR - Columbia University, Center for International Earth Science Information Network - CIESIN - Columbia University. 2005. Global Earthquake Hazard Distribution - Peak Ground Acceleration. Palisades, NY: NASA Socioeconomic Data and Applications Center (SEDAC). https://doi.org/10.7927/H4BZ63ZS.
Recent Nearby Earthquakes
Magnitude 3.0 and greater
| Date▼ | Time↕ | Magnitude↕ | Distance↕ | Depth↕ | Location↕ | Link |
|---|---|---|---|---|---|---|
| 2/8/16 | 9:16 PM | 4.7 | 65.1 km | 10,000 m | 15km SW of San Juan Xiutetelco, Mexico | usgs.gov |
| 1/6/15 | 6:10 PM | 4.1 | 98.7 km | 33,080 m | 13km WNW of Veracruz, Mexico | usgs.gov |
| 9/3/13 | 4:14 PM | 4.3 | 33.7 km | 16,600 m | 6km E of Nautla, Mexico | usgs.gov |
| 7/6/12 | 5:32 AM | 4.1 | 60.1 km | 17,400 m | Veracruz, Mexico | usgs.gov |
| 9/28/11 | 10:51 AM | 4.1 | 28.9 km | 23,000 m | Veracruz, Mexico | usgs.gov |
| 11/28/06 | 2:34 PM | 3.6 | 79.8 km | 9,500 m | offshore Veracruz, Mexico | usgs.gov |
| 4/15/06 | 12:31 AM | 3.9 | 80.7 km | 41,600 m | Veracruz, Mexico | usgs.gov |
| 1/21/02 | 6:15 PM | 4.1 | 86.7 km | 97,100 m | Puebla, Mexico | usgs.gov |
| 7/9/01 | 1:46 PM | 3.7 | 97.3 km | 25,700 m | Veracruz, Mexico | usgs.gov |
| 8/11/00 | 8:19 AM | 4.1 | 63.1 km | 4,600 m | Veracruz, Mexico | usgs.gov |
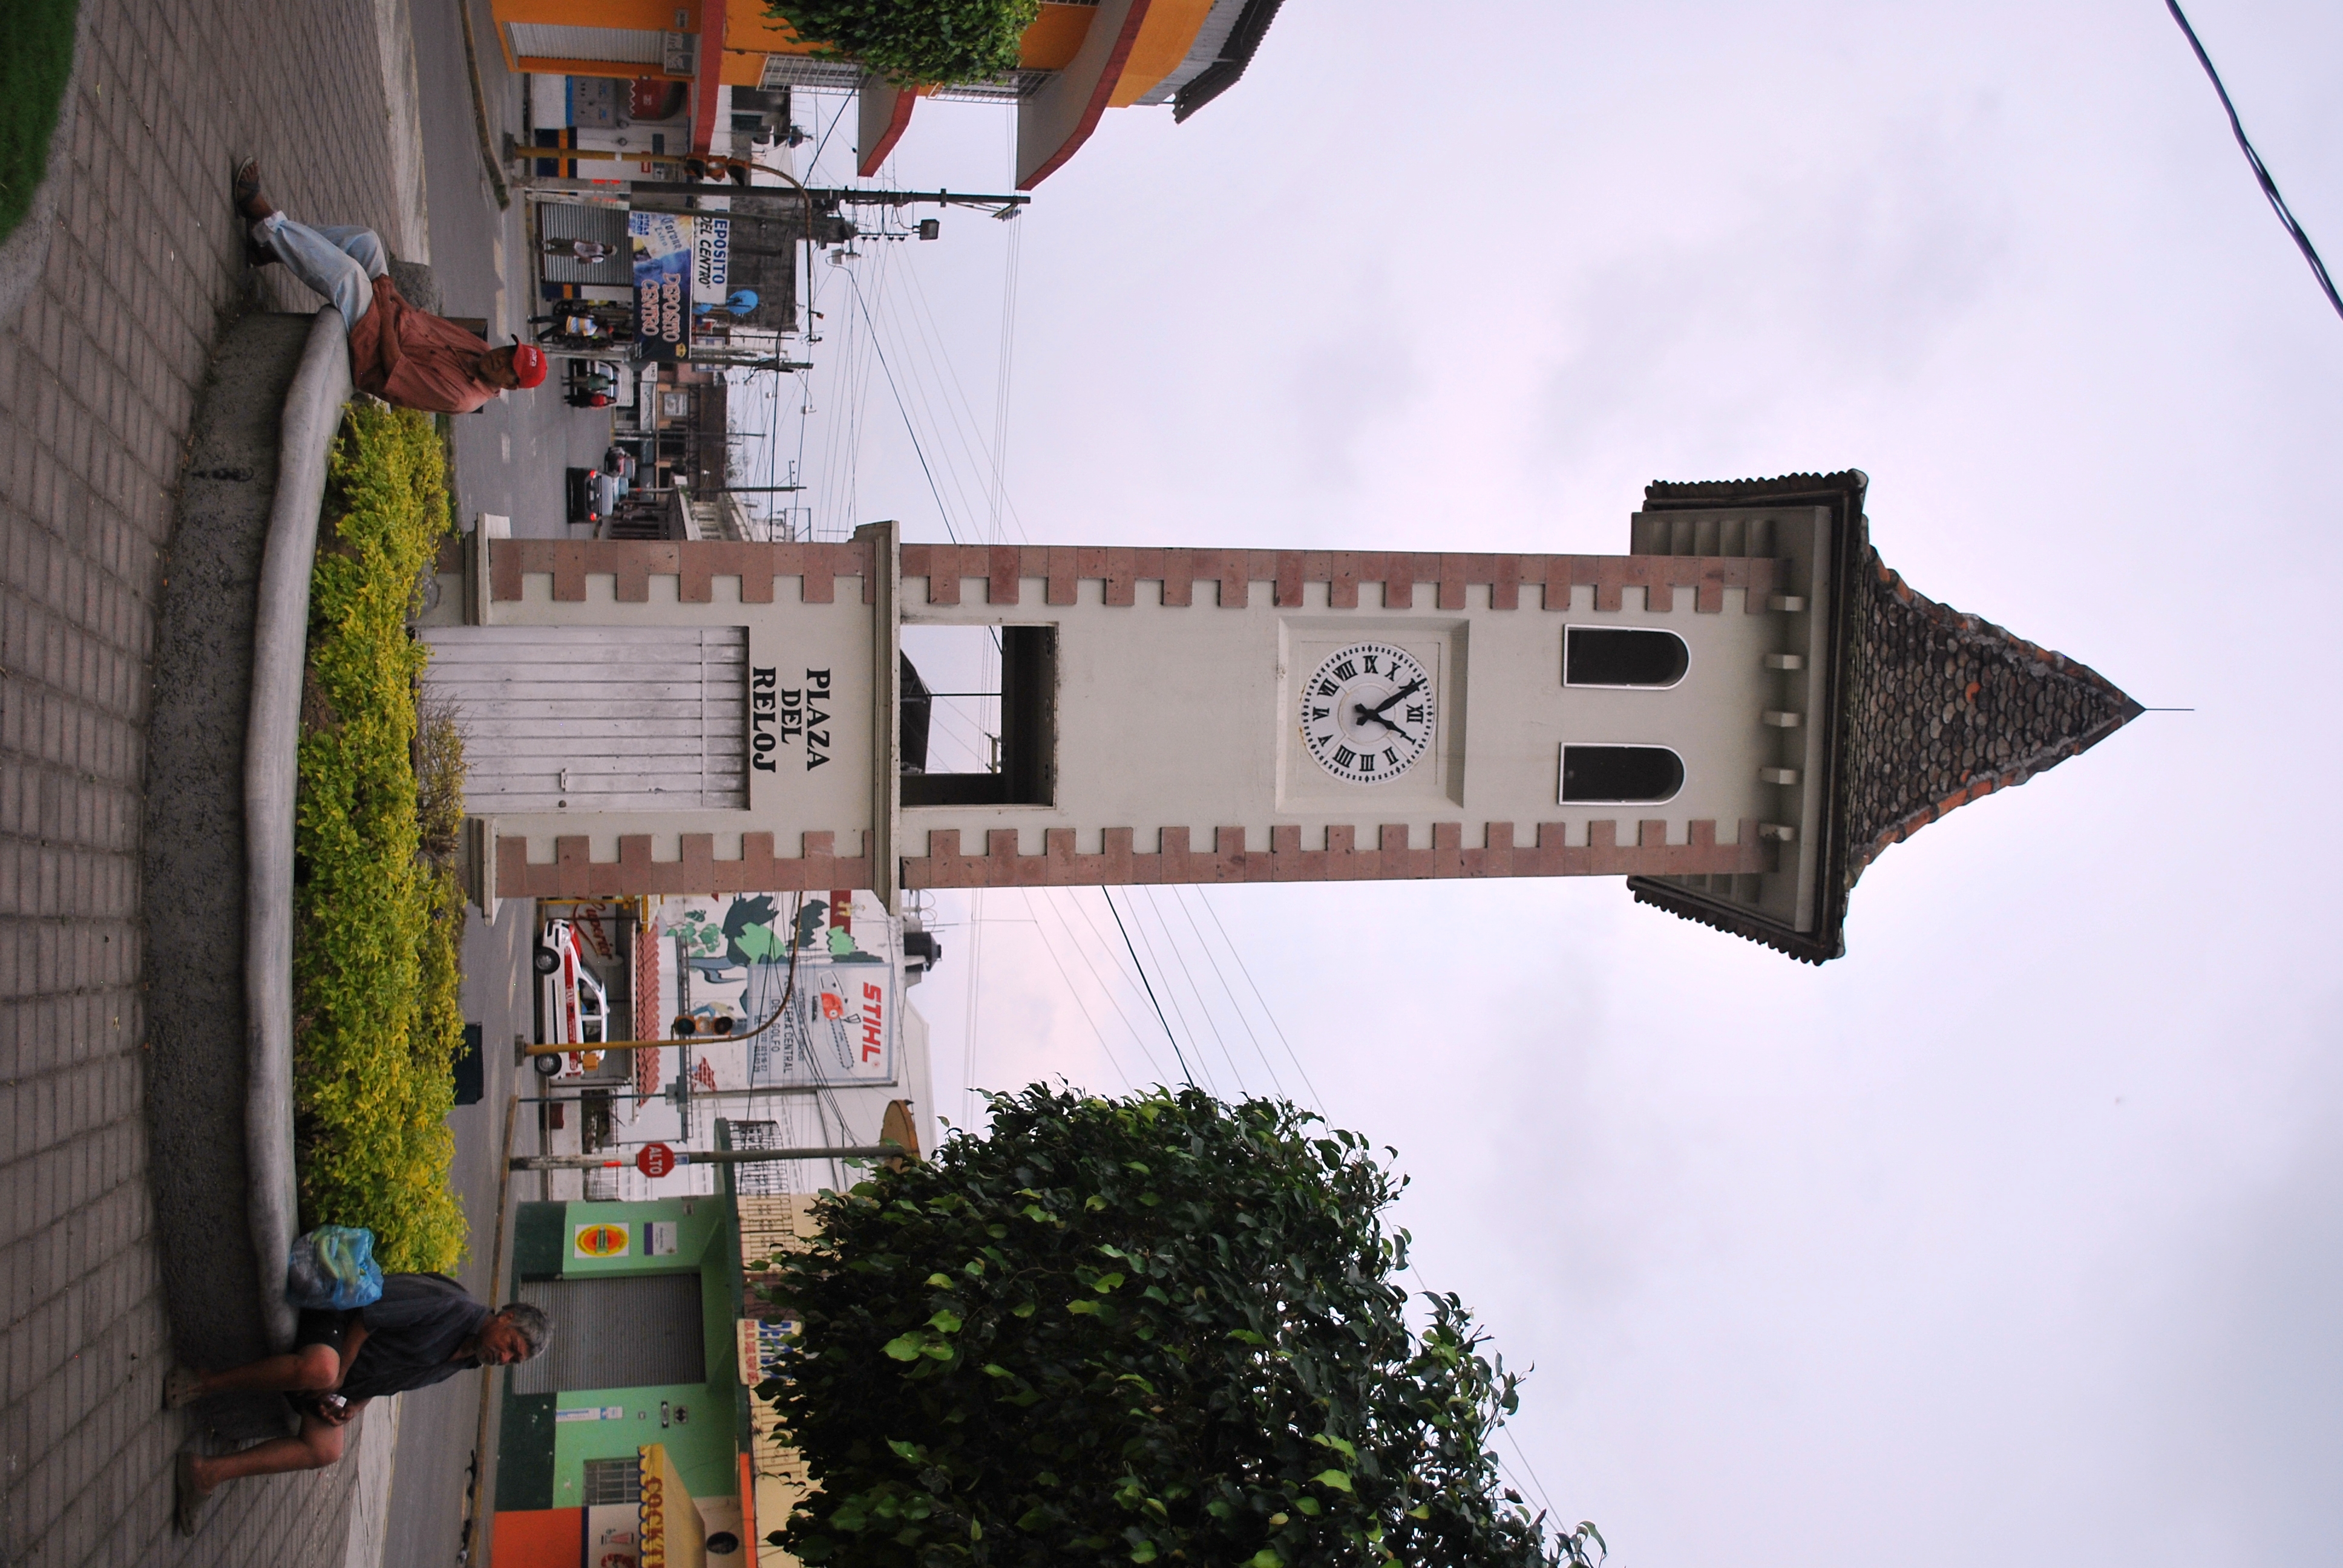
Misantla
Misantla is a city in the Mexican state of Veracruz, the administrative seats of the municipality (municipio) of the same name. The municipality is bordered by Martínez de la Torre, Colipa and Papantla. , Misantla is about 35 km (22 mi) from the beac..
Misantla Wikipedia Page
About Our Data
The data on this page is estimated using a number of publicly available tools and resources. It is provided without warranty, and could contain inaccuracies. Use at your own risk.