Industries
Business Distribution by Industry in Quitupan
| Industry Description | Number of Establishments |
|---|---|
| Education | 17 |
| Restaurants | 17 |
| Grocery stores and supermarkets | 16 |
| Churches | 11 |
| Public administration | 8 |
| Hardware store | 6 |
| Public parks | 6 |
| Car repair | 5 |
| Pharmacies and drug stores | 5 |
| Stadiums and arenas | 5 |
| Shopping | 5 |
Quitupan Facts
| Area | 1.2 km² |
| Population | 1,697 |
| Male Population | 797 (47.0%) |
| Female Population | 900 (53.0%) |
| Population change (1975 to 2020) | +50.2% |
| Population change (2000 to 2020) | +7.3% |
| Median Age | 28.6 years (Male: 25.7, Female: 30.9) |
| Area Codes | 467 |
| Neighborhoods | Quitupan, Centro, Col. Centro, Colonia de la Cruz |
| Local Time | |
| Timezone | Central Standard Time |
| Lat & Lng | 19.85000, -102.83333 |
| Postal Codes | 49570, 49574, 49575, 49576, 49578, More |
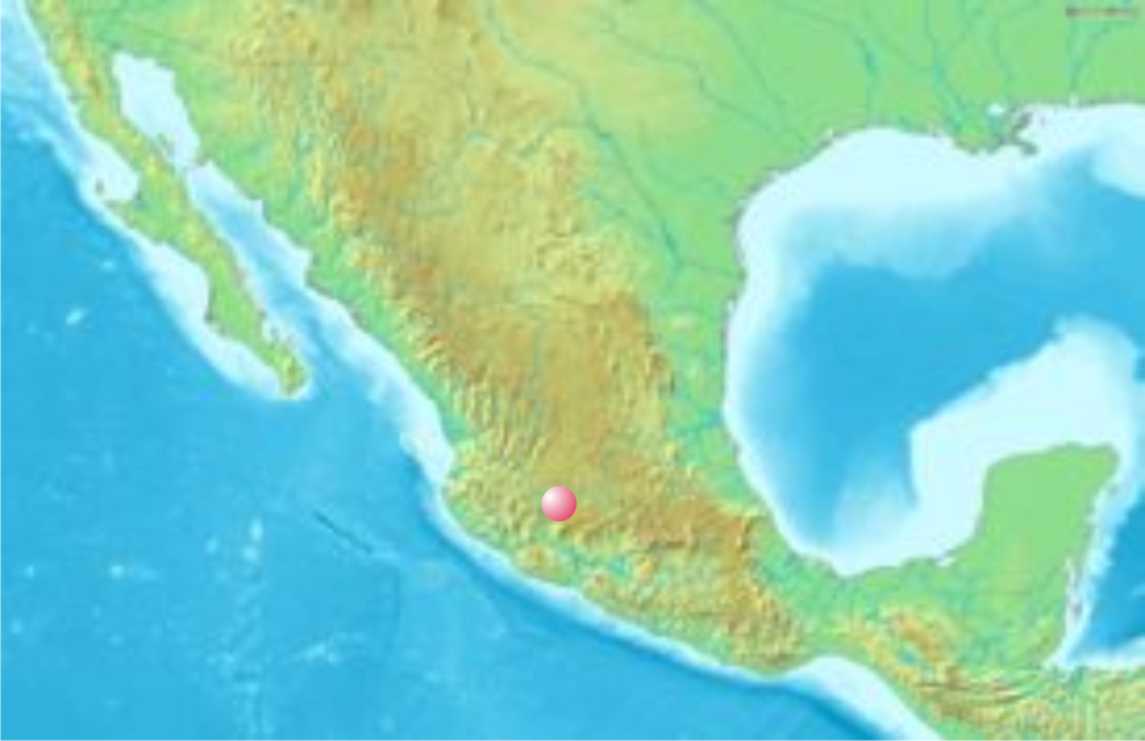
Map of Quitupan
Interactive Map
Quitupan Population
Years 1975 to 2020
| Data | 1975 | 1990 | 2000 | 2015 | 2020 |
|---|---|---|---|---|---|
| Population | 1,130 | 1,446 | 1,582 | 1,621 | 1,697 |
| Population Density | 951.6 / km² | 1,217.7 / km² | 1,332.2 / km² | 1,365.1 / km² | 1,429.1 / km² |
Quitupan Population change from 2000 to 2015
Increase of 2.5% from year 2000 to 2015
| Location | Change since 1975 | Change since 1990 | Change since 2000 |
|---|---|---|---|
| Quitupan | +43.5% | +12.1% | +2.5% |
| Jalisco | +84.6% | +43.3% | +24.1% |
| Mexico | +108.7% | +48.4% | +23.5% |
Quitupan Median Age
Median Age: 28.6 years
| Location | Median Age | Median Age (Female) | Median Age (Male) |
|---|---|---|---|
| Quitupan | 28.6 yrs | 30.9 yrs | 25.7 yrs |
| Jalisco | 25.9 yrs | 26.8 yrs | 25.1 yrs |
| Mexico | 26.2 yrs | 27 yrs | 25.3 yrs |
Quitupan Population Density
Population Density: 1,429 / km²
| Location | Population | Area | Density |
|---|---|---|---|
| Quitupan | 1,697 | 1.188 km² | 1,429 / km² |
| Jalisco | 8.4 million | 78,597.4 km² | 107 / km² |
| Mexico | 126.8 million | 1,965,208 km² | 64.5 / km² |
Quitupan Historical and Projected Population
Estimated Population from 0 to 2100
- JRC (European Commission's Joint Research Centre) work on the GHS built-up grid
- CIESIN (Center for International Earth Science Information Network)
- [Link] Klein Goldewijk, K., Beusen, A., Doelman, J., and Stehfest, E.: Anthropogenic land use estimates for the Holocene – HYDE 3.2, Earth Syst. Sci. Data, 9, 927–953, https://doi.org/10.5194/essd-9-927-2017, 2017.
Neighborhoods in Quitupan
Percentage of businesses by neighborhood in Quitupan
Postal Codes
Percentage of businesses by Postal Codes in Quitupan
Human Development Index (HDI)
Statistic composite index of life expectancy, education, and per capita income.
Quitupan CO2 Emissions
Carbon Dioxide (CO2) Emissions Per Capita in Tonnes Per Year
| Location | CO2 Emissions | CO2 Emissions Per Capita | CO2 Emissions Intensity |
|---|---|---|---|
| Quitupan | 6,949 tn | 4.09 tn | 5,851.8 tons/km² |
| Jalisco | 34,421,540 tn | 4.09 tn | 437.9 tons/km² |
| Mexico | 496,865,013 tn | 3.92 tn | 252.8 tons/km² |
| 2013 CO2 emissions (tonnes/year) | 6,949 tn |
| 2013 CO2 emissions (tonnes/year) per capita | 4.09 tn |
| 2013 CO2 emissions intensity (tonnes/km²/year) | 5,851.8 tons/km² |
Natural Hazards Risk
Relative risk out of 10
| Hazard | Risk Level |
|---|---|
| Drought | Medium (7) |
| Flood | Medium (4) |
| Earthquake | High (9) |
| Landslide | High (8) |
* Risk, particularly concerning flood or landslide, may not be for the entire area.
- Dilley, M., R.S. Chen, U. Deichmann, A.L. Lerner-Lam, M. Arnold, J. Agwe, P. Buys, O. Kjekstad, B. Lyon, and G. Yetman. 2005. Natural Disaster Hotspots: A Global Risk Analysis. Washington, D.C.: World Bank. https://doi.org/10.1596/0-8213-5930-4.
- Center for Hazards and Risk Research - CHRR - Columbia University, Center for International Earth Science Information Network - CIESIN - Columbia University, and Norwegian Geotechnical Institute - NGI. 2005. Global Landslide Hazard Distribution. Palisades, NY: NASA Socioeconomic Data and Applications Center (SEDAC). https://doi.org/10.7927/H4P848VZ.
- Center for Hazards and Risk Research - CHRR - Columbia University, Center for International Earth Science Information Network - CIESIN - Columbia University, and International Research Institute for Climate and Society - IRI - Columbia University. 2005. Global Drought Hazard Frequency and Distribution. Palisades, NY: NASA Socioeconomic Data and Applications Center (SEDAC). https://doi.org/10.7927/H4VX0DFT.
- Center for Hazards and Risk Research - CHRR - Columbia University, Center for International Earth Science Information Network - CIESIN - Columbia University. 2005. Global Flood Hazard Frequency and Distribution. Palisades, NY: NASA Socioeconomic Data and Applications Center (SEDAC). https://doi.org/10.7927/H4668B3D.
- Center for Hazards and Risk Research - CHRR - Columbia University, Center for International Earth Science Information Network - CIESIN - Columbia University. 2005. Global Earthquake Hazard Distribution - Peak Ground Acceleration. Palisades, NY: NASA Socioeconomic Data and Applications Center (SEDAC). https://doi.org/10.7927/H4BZ63ZS.
Recent Nearby Earthquakes
Magnitude 3.0 and greater
| Date▼ | Time↕ | Magnitude↕ | Distance↕ | Depth↕ | Location↕ | Link |
|---|---|---|---|---|---|---|
| 10/4/17 | 3:16 AM | 4.3 | 82.1 km | 20,780 m | 8km SSE of Tepalcatepec, Mexico | usgs.gov |
| 5/18/12 | 3:07 AM | 4.2 | 71.3 km | 5,000 m | Jalisco, Mexico | usgs.gov |
| 11/19/11 | 3:46 AM | 4.4 | 92.7 km | 60,000 m | Michoacan, Mexico | usgs.gov |
| 4/2/11 | 2:55 PM | 4.2 | 94.4 km | 114,000 m | Michoacan, Mexico | usgs.gov |
| 10/9/08 | 12:10 PM | 3.9 | 62.6 km | 37,200 m | Jalisco, Mexico | usgs.gov |
| 8/24/08 | 12:08 AM | 4.5 | 88.7 km | 101,200 m | Jalisco, Mexico | usgs.gov |
| 4/28/08 | 6:40 PM | 3.9 | 51.1 km | 70,700 m | Jalisco, Mexico | usgs.gov |
| 1/17/08 | 4:50 PM | 3.7 | 64.3 km | 86,500 m | Michoacan, Mexico | usgs.gov |
| 11/7/07 | 2:28 PM | 4 | 97.5 km | 10,000 m | Michoacan, Mexico | usgs.gov |
| 10/17/06 | 6:14 PM | 4 | 94.8 km | 22,000 m | Michoacan, Mexico | usgs.gov |
Quitupan
Quitupan is a town and municipality located in the southeastern region of the Mexican state of Jalisco. The name Quitupan comes from the word "Quitoa" or "Quitla," which means "place where declarations or treaties come from" or "place that is located..
Quitupan Wikipedia Page


About Our Data
The data on this page is estimated using a number of publicly available tools and resources. It is provided without warranty, and could contain inaccuracies. Use at your own risk.