Categories in Taxco
Industries
Business Distribution by Industry in Taxco
| Industry Description | Number of Establishments | Average Age of Business |
|---|---|---|
| Restaurants | 258 | — |
| Shopping | 229 | 29 years |
| Jewelers and watches | 205 | — |
| Education | 108 | — |
| Grocery stores and supermarkets | 89 | — |
| Hotels and motels | 67 | — |
| Shopping other | 67 | — |
| Other accommodation | 65 | — |
| Convenience stores | 58 | — |
| Bars, pubs and taverns | 53 | — |
| Churches | 51 | — |
| Clothing stores | 45 | — |
| Religion | 44 | — |
Taxco Facts
| Area | 11.2 km² |
| Population | 59,372 |
| Male Population | 28,528 (48.0%) |
| Female Population | 30,844 (52.0%) |
| Population change (1975 to 2020) | +89.3% |
| Population change (2000 to 2020) | +17.2% |
| Median Age | 27.8 years (Male: 26.2, Female: 29.2) |
| Area Codes | 467 |
| Neighborhoods | Centro, Barrio de la Garita, Barrio de la Catarina, Barrio del Chorrillo, Taxco de Alarcón Centro |
| Local Time | |
| Timezone | Central Standard Time |
| Lat & Lng | 18.55629, -99.60491 |
| Postal Codes | 40200, 40210, 40211, 40212, 40213, More |
Map of Taxco
Interactive Map
Taxco Population
Years 1975 to 2020
| Data | 1975 | 1990 | 2000 | 2015 | 2020 |
|---|---|---|---|---|---|
| Population | 31,362 | 43,628 | 50,653 | 56,433 | 59,372 |
| Population Density | 2,803.3 / km² | 3,899.7 / km² | 4,527.6 / km² | 5,044.3 / km² | 5,307 / km² |
Taxco Population change from 2000 to 2015
Increase of 11.4% from year 2000 to 2015
| Location | Change since 1975 | Change since 1990 | Change since 2000 |
|---|---|---|---|
| Taxco | +79.9% | +29.4% | +11.4% |
| Guerrero | +125.1% | +51.1% | +23% |
| Mexico | +108.7% | +48.4% | +23.5% |
Taxco Median Age
Median Age: 27.8 years
| Location | Median Age | Median Age (Female) | Median Age (Male) |
|---|---|---|---|
| Taxco | 27.8 yrs | 29.2 yrs | 26.2 yrs |
| Guerrero | 23.2 yrs | 24.1 yrs | 22.3 yrs |
| Mexico | 26.2 yrs | 27 yrs | 25.3 yrs |
Taxco Population Density
Population Density: 5,307 / km²
| Location | Population | Area | Density |
|---|---|---|---|
| Taxco | 59,372 | 11.2 km² | 5,307 / km² |
| Guerrero | 3.8 million | 63,596.7 km² | 59.3 / km² |
| Mexico | 126.8 million | 1,965,208 km² | 64.5 / km² |
Taxco Historical and Projected Population
Estimated Population from 1820 to 2100
- JRC (European Commission's Joint Research Centre) work on the GHS built-up grid
- CIESIN (Center for International Earth Science Information Network)
- [Link] Klein Goldewijk, K., Beusen, A., Doelman, J., and Stehfest, E.: Anthropogenic land use estimates for the Holocene – HYDE 3.2, Earth Syst. Sci. Data, 9, 927–953, https://doi.org/10.5194/essd-9-927-2017, 2017.
Neighborhoods in Taxco
Percentage of businesses by neighborhood in Taxco
Postal Codes
Percentage of businesses by Postal Codes in Taxco
Price Distribution
Business distribution by price for Taxco
Human Development Index (HDI)
Statistic composite index of life expectancy, education, and per capita income.
Taxco CO2 Emissions
Carbon Dioxide (CO2) Emissions Per Capita in Tonnes Per Year
| Location | CO2 Emissions | CO2 Emissions Per Capita | CO2 Emissions Intensity |
|---|---|---|---|
| Taxco | 197,619 tn | 3.33 tn | 17,664.2 tons/km² |
| Guerrero | 12,480,202 tn | 3.31 tn | 196.2 tons/km² |
| Mexico | 496,865,013 tn | 3.92 tn | 252.8 tons/km² |
| 2013 CO2 emissions (tonnes/year) | 197,619 tn |
| 2013 CO2 emissions (tonnes/year) per capita | 3.33 tn |
| 2013 CO2 emissions intensity (tonnes/km²/year) | 17,664.2 tons/km² |
Natural Hazards Risk
Relative risk out of 10
| Hazard | Risk Level |
|---|---|
| Drought | Medium (4) |
| Flood | High (8) |
| Earthquake | Medium (7) |
| Landslide | Medium (7) |
* Risk, particularly concerning flood or landslide, may not be for the entire area.
- Dilley, M., R.S. Chen, U. Deichmann, A.L. Lerner-Lam, M. Arnold, J. Agwe, P. Buys, O. Kjekstad, B. Lyon, and G. Yetman. 2005. Natural Disaster Hotspots: A Global Risk Analysis. Washington, D.C.: World Bank. https://doi.org/10.1596/0-8213-5930-4.
- Center for Hazards and Risk Research - CHRR - Columbia University, Center for International Earth Science Information Network - CIESIN - Columbia University, and Norwegian Geotechnical Institute - NGI. 2005. Global Landslide Hazard Distribution. Palisades, NY: NASA Socioeconomic Data and Applications Center (SEDAC). https://doi.org/10.7927/H4P848VZ.
- Center for Hazards and Risk Research - CHRR - Columbia University, Center for International Earth Science Information Network - CIESIN - Columbia University, and International Research Institute for Climate and Society - IRI - Columbia University. 2005. Global Drought Hazard Frequency and Distribution. Palisades, NY: NASA Socioeconomic Data and Applications Center (SEDAC). https://doi.org/10.7927/H4VX0DFT.
- Center for Hazards and Risk Research - CHRR - Columbia University, Center for International Earth Science Information Network - CIESIN - Columbia University. 2005. Global Flood Hazard Frequency and Distribution. Palisades, NY: NASA Socioeconomic Data and Applications Center (SEDAC). https://doi.org/10.7927/H4668B3D.
- Center for Hazards and Risk Research - CHRR - Columbia University, Center for International Earth Science Information Network - CIESIN - Columbia University. 2005. Global Earthquake Hazard Distribution - Peak Ground Acceleration. Palisades, NY: NASA Socioeconomic Data and Applications Center (SEDAC). https://doi.org/10.7927/H4BZ63ZS.
Recent Nearby Earthquakes
Magnitude 3.0 and greater
| Date▼ | Time↕ | Magnitude↕ | Distance↕ | Depth↕ | Location↕ | Link |
|---|---|---|---|---|---|---|
| 8/28/15 | 1:56 AM | 4 | 47.8 km | 51,700 m | 17km S of Tepecoacuilco de Trujano, Mexico | usgs.gov |
| 12/27/14 | 1:33 PM | 4 | 30.7 km | 55,600 m | 5km N of Teloloapan, Mexico | usgs.gov |
| 1/7/14 | 6:09 AM | 4.2 | 59.6 km | 49,900 m | 12km SSE of Apaxtla de Castrejon, Mexico | usgs.gov |
| 1/2/14 | 10:37 AM | 4 | 70.9 km | 54,800 m | 25km SSE of Apaxtla de Castrejon, Mexico | usgs.gov |
| 6/29/13 | 9:19 PM | 4.5 | 56.5 km | 55,100 m | 14km NNW of Copalillo, Mexico | usgs.gov |
| 6/18/13 | 4:33 PM | 4 | 70.3 km | 52,700 m | Guerrero, Mexico | usgs.gov |
| 6/16/13 | 5:19 AM | 5.8 | 61.5 km | 52,000 m | 15km NW of Copalillo, Mexico | usgs.gov |
| 2/23/13 | 11:44 AM | 4.1 | 49.4 km | 38,000 m | 14km S of Huitzuco de los Figueroa, Mexico | usgs.gov |
| 1/26/13 | 11:14 AM | 4.1 | 51.3 km | 51,700 m | 17km SSE of Cocula, Mexico | usgs.gov |
| 7/17/12 | 3:57 PM | 4.1 | 34.6 km | 75,700 m | Guerrero, Mexico | usgs.gov |
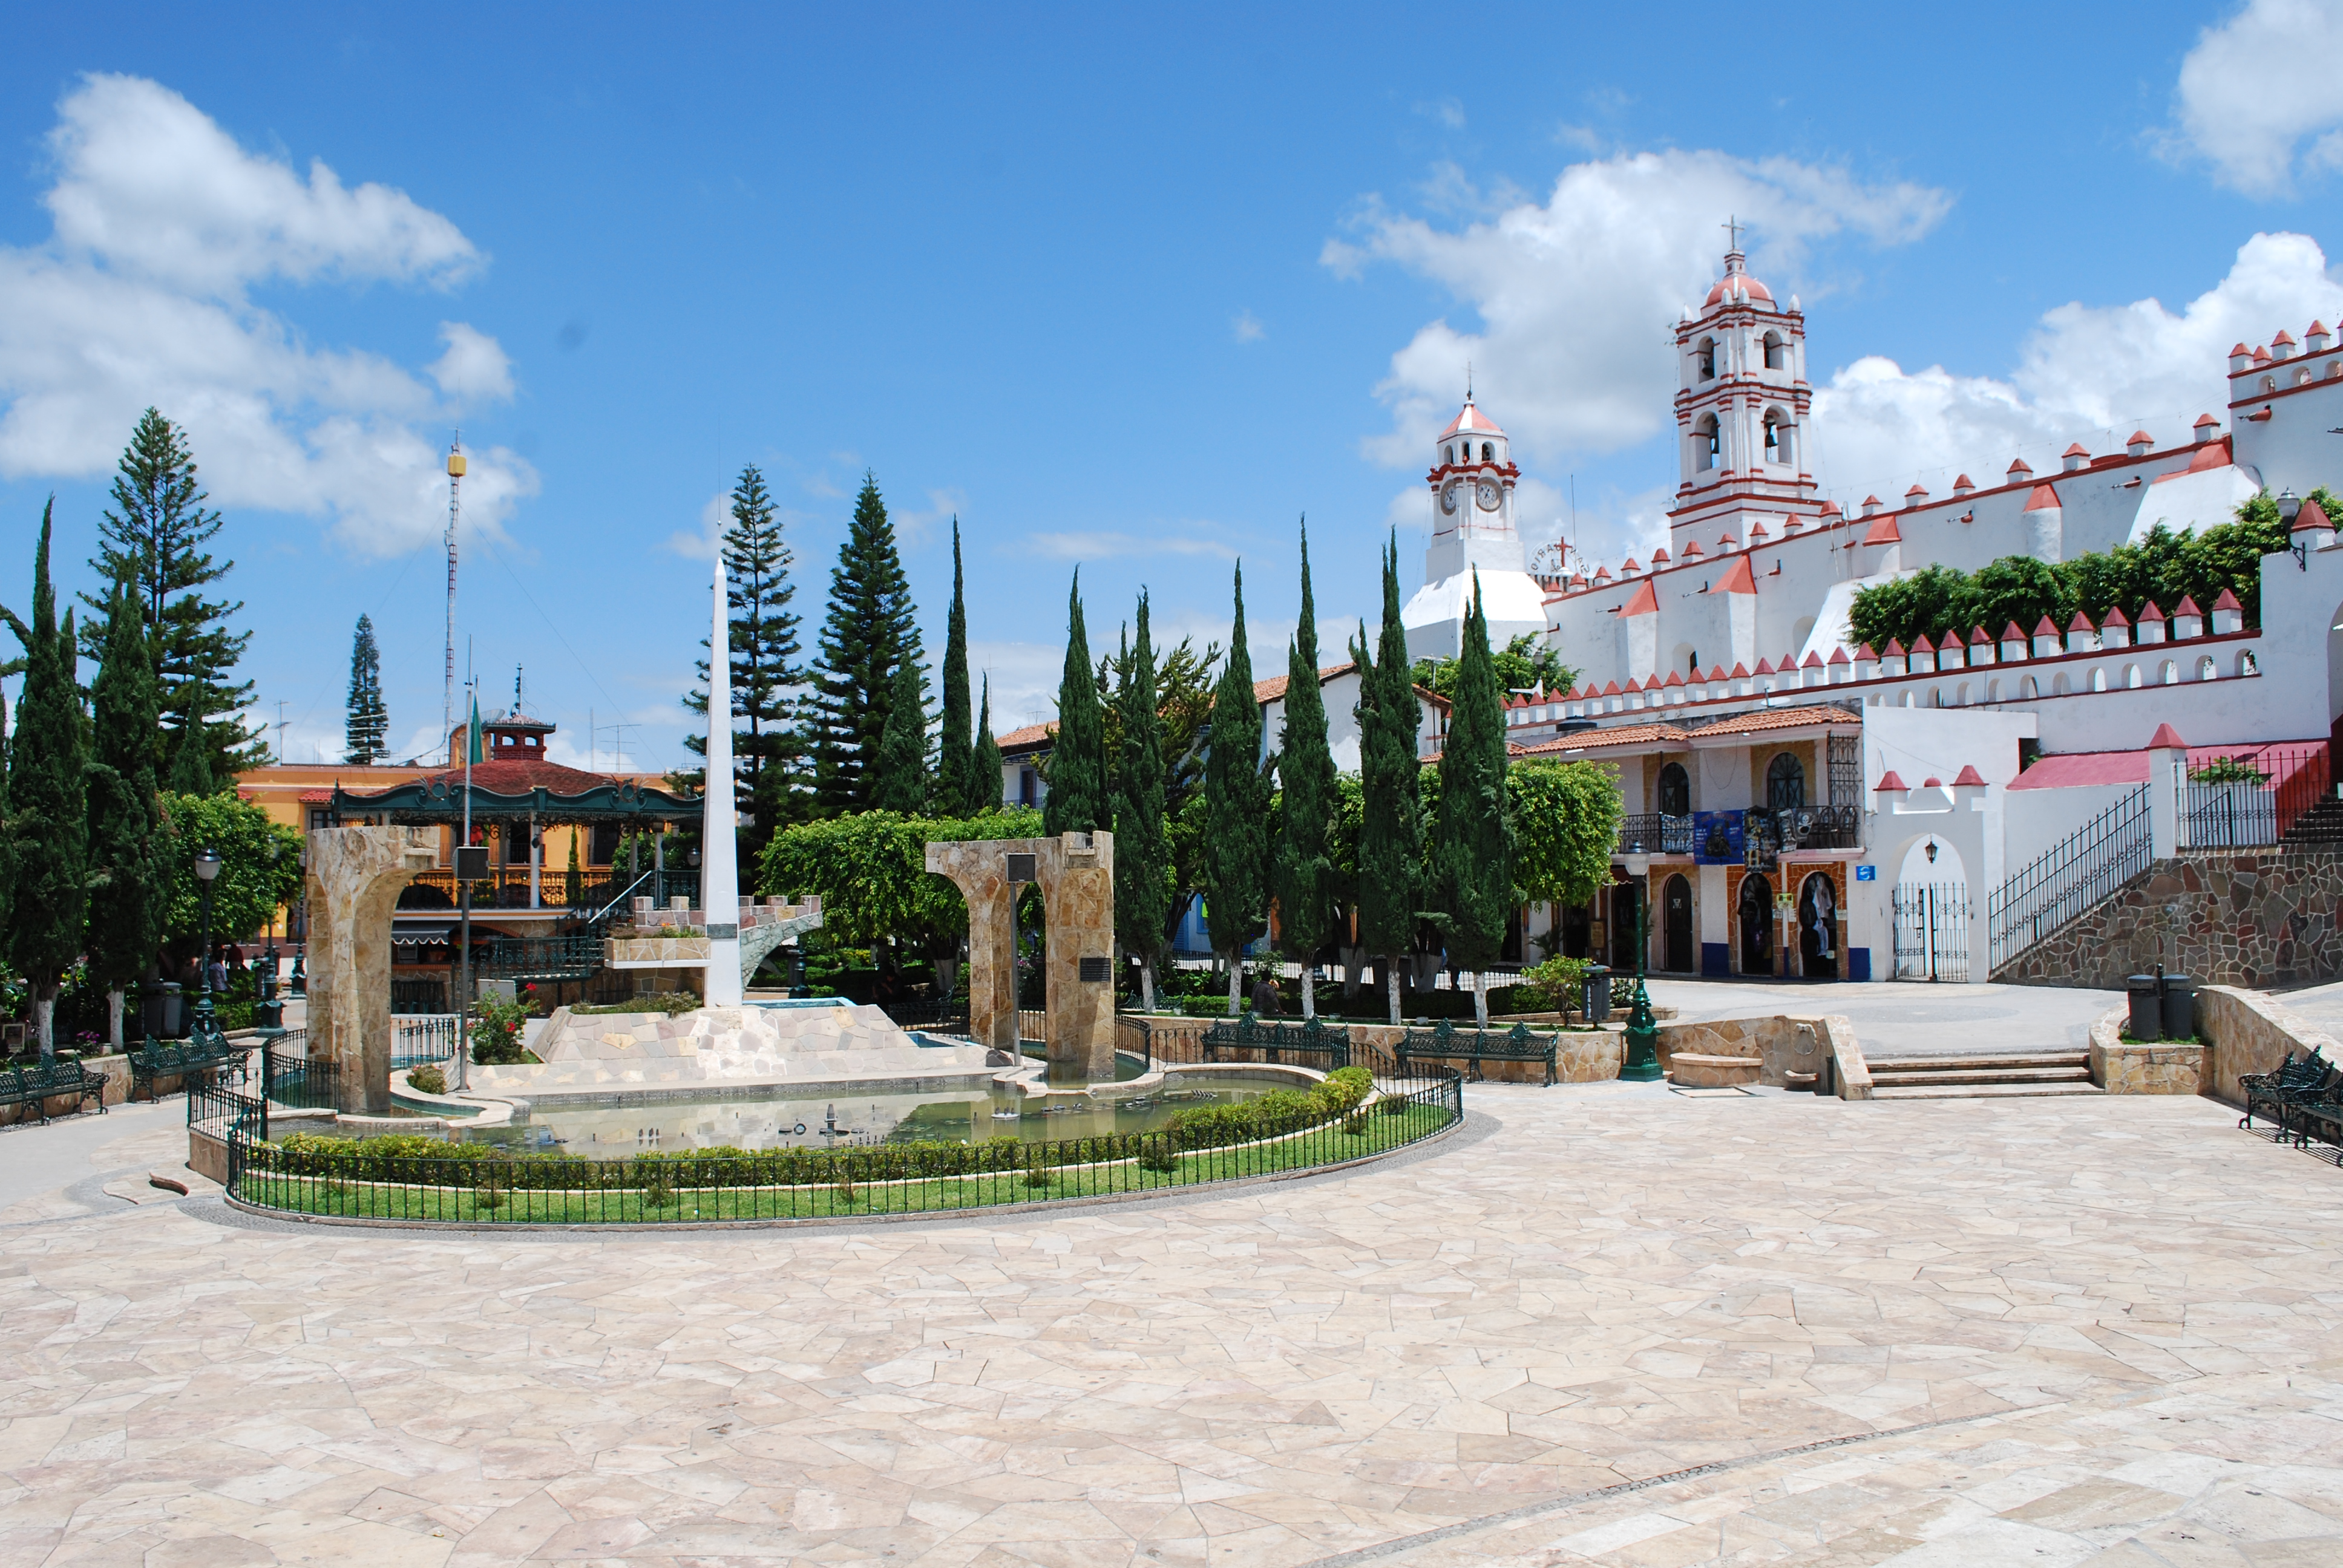
Taxco
Taxco de Alarcón (usually referred to as simply Taxco) (Spanish [ta'sco] ) is a small city and administrative center of a Taxco de Alarcón Municipality located in the Mexican state of Guerrero. Taxco is located in the north-central part of the state..
Taxco Wikipedia Page


About Our Data
The data on this page is estimated using a number of publicly available tools and resources. It is provided without warranty, and could contain inaccuracies. Use at your own risk.