Categories in Teopisca
Industries
Business Distribution by Industry in Teopisca
| Industry Description | Number of Establishments |
|---|---|
| Restaurants | 57 |
| Shopping | 55 |
| Grocery stores and supermarkets | 43 |
| Churches | 35 |
| Education | 29 |
| Clothing stores | 18 |
| Pharmacies and drug stores | 16 |
| Hardware store | 14 |
| Car repair | 14 |
| Bakeries | 13 |
Teopisca Facts
| Area | 6.5 km² |
| Population | 20,441 |
| Male Population | 9,929 (48.6%) |
| Female Population | 10,512 (51.4%) |
| Population change (1975 to 2020) | +317.9% |
| Population change (2000 to 2020) | +58.1% |
| Median Age | 21.9 years (Male: 21.3, Female: 22.4) |
| Area Codes | 467 |
| Neighborhoods | Centro, San Sebastián, Guadalupe, Ramajal, San José |
| Local Time | |
| Timezone | Central Standard Time |
| Lat & Lng | 16.54345, -92.47597 |
| Postal Codes | 29410, 29412, 29416, 29417, 29419, More |
Map of Teopisca
Interactive Map
Teopisca Population
Years 1975 to 2020
| Data | 1975 | 1990 | 2000 | 2015 | 2020 |
|---|---|---|---|---|---|
| Population | 4,891 | 9,143 | 12,932 | 19,375 | 20,441 |
| Population Density | 752.5 / km² | 1,406.6 / km² | 1,989.5 / km² | 2,980.8 / km² | 3,144.8 / km² |
Teopisca Population change from 2000 to 2015
Increase of 49.8% from year 2000 to 2015
| Location | Change since 1975 | Change since 1990 | Change since 2000 |
|---|---|---|---|
| Teopisca | +296.1% | +111.9% | +49.8% |
| Chiapas | +178% | +72.8% | +33.3% |
| Mexico | +108.7% | +48.4% | +23.5% |
Teopisca Median Age
Median Age: 21.9 years
| Location | Median Age | Median Age (Female) | Median Age (Male) |
|---|---|---|---|
| Teopisca | 21.9 yrs | 22.4 yrs | 21.3 yrs |
| Chiapas | 22.2 yrs | 22.7 yrs | 21.6 yrs |
| Mexico | 26.2 yrs | 27 yrs | 25.3 yrs |
Teopisca Population Density
Population Density: 3,145 / km²
| Location | Population | Area | Density |
|---|---|---|---|
| Teopisca | 20,441 | 6.5 km² | 3,145 / km² |
| Chiapas | 5.5 million | 73,311 km² | 75.4 / km² |
| Mexico | 126.8 million | 1,965,208 km² | 64.5 / km² |
Teopisca Historical and Projected Population
Estimated Population from 1890 to 2100
- JRC (European Commission's Joint Research Centre) work on the GHS built-up grid
- CIESIN (Center for International Earth Science Information Network)
- [Link] Klein Goldewijk, K., Beusen, A., Doelman, J., and Stehfest, E.: Anthropogenic land use estimates for the Holocene – HYDE 3.2, Earth Syst. Sci. Data, 9, 927–953, https://doi.org/10.5194/essd-9-927-2017, 2017.
Neighborhoods in Teopisca
Percentage of businesses by neighborhood in Teopisca
Price Distribution
Business distribution by price for Teopisca
Human Development Index (HDI)
Statistic composite index of life expectancy, education, and per capita income.
Teopisca CO2 Emissions
Carbon Dioxide (CO2) Emissions Per Capita in Tonnes Per Year
| Location | CO2 Emissions | CO2 Emissions Per Capita | CO2 Emissions Intensity |
|---|---|---|---|
| Teopisca | 64,824 tn | 3.17 tn | 9,973 tons/km² |
| Chiapas | 17,416,827 tn | 3.15 tn | 237.6 tons/km² |
| Mexico | 496,865,013 tn | 3.92 tn | 252.8 tons/km² |
| 2013 CO2 emissions (tonnes/year) | 64,824 tn |
| 2013 CO2 emissions (tonnes/year) per capita | 3.17 tn |
| 2013 CO2 emissions intensity (tonnes/km²/year) | 9,973 tons/km² |
Natural Hazards Risk
Relative risk out of 10
| Hazard | Risk Level |
|---|---|
| Drought | High (10) |
| Flood | Medium (7) |
| Earthquake | Medium (7) |
| Landslide | Medium (6) |
* Risk, particularly concerning flood or landslide, may not be for the entire area.
- Dilley, M., R.S. Chen, U. Deichmann, A.L. Lerner-Lam, M. Arnold, J. Agwe, P. Buys, O. Kjekstad, B. Lyon, and G. Yetman. 2005. Natural Disaster Hotspots: A Global Risk Analysis. Washington, D.C.: World Bank. https://doi.org/10.1596/0-8213-5930-4.
- Center for Hazards and Risk Research - CHRR - Columbia University, Center for International Earth Science Information Network - CIESIN - Columbia University, and Norwegian Geotechnical Institute - NGI. 2005. Global Landslide Hazard Distribution. Palisades, NY: NASA Socioeconomic Data and Applications Center (SEDAC). https://doi.org/10.7927/H4P848VZ.
- Center for Hazards and Risk Research - CHRR - Columbia University, Center for International Earth Science Information Network - CIESIN - Columbia University, and International Research Institute for Climate and Society - IRI - Columbia University. 2005. Global Drought Hazard Frequency and Distribution. Palisades, NY: NASA Socioeconomic Data and Applications Center (SEDAC). https://doi.org/10.7927/H4VX0DFT.
- Center for Hazards and Risk Research - CHRR - Columbia University, Center for International Earth Science Information Network - CIESIN - Columbia University. 2005. Global Flood Hazard Frequency and Distribution. Palisades, NY: NASA Socioeconomic Data and Applications Center (SEDAC). https://doi.org/10.7927/H4668B3D.
- Center for Hazards and Risk Research - CHRR - Columbia University, Center for International Earth Science Information Network - CIESIN - Columbia University. 2005. Global Earthquake Hazard Distribution - Peak Ground Acceleration. Palisades, NY: NASA Socioeconomic Data and Applications Center (SEDAC). https://doi.org/10.7927/H4BZ63ZS.
Recent Nearby Earthquakes
Magnitude 3.0 and greater
| Date▼ | Time↕ | Magnitude↕ | Distance↕ | Depth↕ | Location↕ | Link |
|---|---|---|---|---|---|---|
| 2/1/19 | 2:03 PM | 4.1 | 83 km | 10,000 m | 15km NNE of Pueblo Nuevo Solistahuacan, Mexico | usgs.gov |
| 7/28/18 | 5:36 PM | 4.3 | 60.9 km | 162,780 m | 26km NNW of Angel Albino Corzo, Mexico | usgs.gov |
| 6/24/18 | 3:21 PM | 4.2 | 76.9 km | 173,700 m | 21km NNE of Villa Corzo, Mexico | usgs.gov |
| 12/31/17 | 9:22 PM | 4.4 | 55.3 km | 207,460 m | 30km NE of San Pedro Buenavista, Mexico | usgs.gov |
| 10/19/17 | 2:17 AM | 4.2 | 79.5 km | 168,100 m | 7km WSW of Angel Albino Corzo, Mexico | usgs.gov |
| 8/21/17 | 6:39 PM | 4.2 | 47.3 km | 226,210 m | 26km SSW of Chiapilla, Mexico | usgs.gov |
| 7/2/17 | 1:39 PM | 4.5 | 76.2 km | 168,350 m | 21km ESE of San Pedro Buenavista, Mexico | usgs.gov |
| 2/4/17 | 7:54 AM | 4.4 | 76.4 km | 164,600 m | 19km ESE of San Pedro Buenavista, Mexico | usgs.gov |
| 2/9/16 | 9:26 PM | 4.9 | 76.3 km | 209,350 m | 13km NW of Chicomuselo, Mexico | usgs.gov |
| 12/6/15 | 2:52 AM | 4.4 | 49.2 km | 229,680 m | 17km SW of Acala, Mexico | usgs.gov |
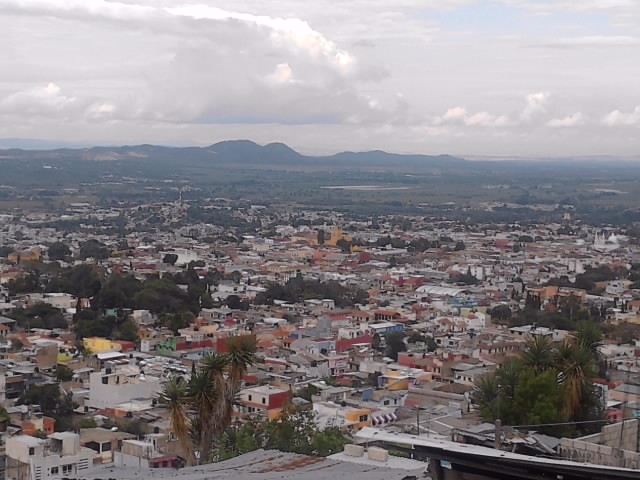
Teopisca
Teopisca is a town and one of the 119 Municipalities of Chiapas, in southern Mexico. of 2010, the municipality had a total population of 37,607, up from 26,996 as of 2005. It covers an area of 174 km². of 2010, the town of Teopisca had a population..
Teopisca Wikipedia Page

About Our Data
The data on this page is estimated using a number of publicly available tools and resources. It is provided without warranty, and could contain inaccuracies. Use at your own risk.