Categories in Uruapan
Industries
Business Distribution by Industry in Uruapan
| Industry Description | Number of Establishments | Average Age of Business |
|---|---|---|
| Restaurants | 1,393 | 27 years |
| Shopping | 1,065 | 28 years |
| Grocery stores and supermarkets | 717 | 29 years |
| Clothing stores | 521 | — |
| Car repair | 492 | 23 years |
| Corporate management | 457 | — |
| Education | 452 | 35 years |
| Dentists | 396 | — |
| Pharmacies and drug stores | 372 | — |
| Hardware store | 338 | 19 years |
| Beauty salons | 326 | — |
| Health and medical | 269 | — |
Uruapan Facts
| Area | 44.4 km² |
| Population | 324,381 |
| Male Population | 156,096 (48.1%) |
| Female Population | 168,285 (51.9%) |
| Population change (1975 to 2020) | +235.1% |
| Population change (2000 to 2020) | +45.7% |
| Median Age | 26.2 years (Male: 24.9, Female: 27.4) |
| Area Codes | 346, 458, 467, 499 |
| Neighborhoods | Colonia, Infonavit Aguacates |
| Local Time | |
| Timezone | Central Standard Time |
| Lat & Lng | 19.41116, -102.05644 |
| Postal Codes | 06018, 60000, 60010, 60013, 60014, More |
Map of Uruapan
Interactive Map
Uruapan Population
Years 1975 to 2020
| Data | 1975 | 1990 | 2000 | 2015 | 2020 |
|---|---|---|---|---|---|
| Population | 96,792 | 166,642 | 222,661 | 306,122 | 324,381 |
| Population Density | 2,181.2 / km² | 3,755.3 / km² | 5,017.7 / km² | 6,898.5 / km² | 7,310 / km² |
Uruapan Population change from 2000 to 2015
Increase of 37.5% from year 2000 to 2015
| Location | Change since 1975 | Change since 1990 | Change since 2000 |
|---|---|---|---|
| Uruapan | +216.3% | +83.7% | +37.5% |
| Michoacán | +136.5% | +56.6% | +26.2% |
| Mexico | +108.7% | +48.4% | +23.5% |
Uruapan Median Age
Median Age: 26.2 years
| Location | Median Age | Median Age (Female) | Median Age (Male) |
|---|---|---|---|
| Uruapan | 26.2 yrs | 27.4 yrs | 24.9 yrs |
| Michoacán | 25 yrs | 25.9 yrs | 24.2 yrs |
| Mexico | 26.2 yrs | 27 yrs | 25.3 yrs |
Uruapan Population Density
Population Density: 7,310 / km²
| Location | Population | Area | Density |
|---|---|---|---|
| Uruapan | 324,381 | 44.4 km² | 7,310 / km² |
| Michoacán | 4.9 million | 58,598.7 km² | 84 / km² |
| Mexico | 126.8 million | 1,965,208 km² | 64.5 / km² |
Uruapan Historical and Projected Population
Estimated Population from 1830 to 2100
- JRC (European Commission's Joint Research Centre) work on the GHS built-up grid
- CIESIN (Center for International Earth Science Information Network)
- [Link] Klein Goldewijk, K., Beusen, A., Doelman, J., and Stehfest, E.: Anthropogenic land use estimates for the Holocene – HYDE 3.2, Earth Syst. Sci. Data, 9, 927–953, https://doi.org/10.5194/essd-9-927-2017, 2017.
Price Distribution
Business distribution by price for Uruapan
Human Development Index (HDI)
Statistic composite index of life expectancy, education, and per capita income.
Uruapan CO2 Emissions
Carbon Dioxide (CO2) Emissions Per Capita in Tonnes Per Year
| Location | CO2 Emissions | CO2 Emissions Per Capita | CO2 Emissions Intensity |
|---|---|---|---|
| Uruapan | 1,199,950 tn | 3.7 tn | 27,041.1 tons/km² |
| Michoacán | 17,436,594 tn | 3.54 tn | 297.6 tons/km² |
| Mexico | 496,865,013 tn | 3.92 tn | 252.8 tons/km² |
| 2013 CO2 emissions (tonnes/year) | 1,199,950 tn |
| 2013 CO2 emissions (tonnes/year) per capita | 3.7 tn |
| 2013 CO2 emissions intensity (tonnes/km²/year) | 27,041.1 tons/km² |
Natural Hazards Risk
Relative risk out of 10
| Hazard | Risk Level |
|---|---|
| Drought | Medium (7) |
| Flood | Medium (4) |
| Earthquake | High (8) |
| Landslide | Medium (7) |
| Volcano | Low (3) |
* Risk, particularly concerning flood or landslide, may not be for the entire area.
- Dilley, M., R.S. Chen, U. Deichmann, A.L. Lerner-Lam, M. Arnold, J. Agwe, P. Buys, O. Kjekstad, B. Lyon, and G. Yetman. 2005. Natural Disaster Hotspots: A Global Risk Analysis. Washington, D.C.: World Bank. https://doi.org/10.1596/0-8213-5930-4.
- Center for Hazards and Risk Research - CHRR - Columbia University, Center for International Earth Science Information Network - CIESIN - Columbia University, and Norwegian Geotechnical Institute - NGI. 2005. Global Landslide Hazard Distribution. Palisades, NY: NASA Socioeconomic Data and Applications Center (SEDAC). https://doi.org/10.7927/H4P848VZ.
- Center for Hazards and Risk Research - CHRR - Columbia University, Center for International Earth Science Information Network - CIESIN - Columbia University, and International Research Institute for Climate and Society - IRI - Columbia University. 2005. Global Drought Hazard Frequency and Distribution. Palisades, NY: NASA Socioeconomic Data and Applications Center (SEDAC). https://doi.org/10.7927/H4VX0DFT.
- Center for Hazards and Risk Research - CHRR - Columbia University, Center for International Earth Science Information Network - CIESIN - Columbia University. 2005. Global Flood Hazard Frequency and Distribution. Palisades, NY: NASA Socioeconomic Data and Applications Center (SEDAC). https://doi.org/10.7927/H4668B3D.
- Center for Hazards and Risk Research - CHRR - Columbia University, Center for International Earth Science Information Network - CIESIN - Columbia University. 2005. Global Volcano Hazard Frequency and Distribution. Palisades, NY: NASA Socioeconomic Data and Applications Center (SEDAC). https://doi.org/10.7927/H4BR8Q45.
- Center for Hazards and Risk Research - CHRR - Columbia University, Center for International Earth Science Information Network - CIESIN - Columbia University. 2005. Global Earthquake Hazard Distribution - Peak Ground Acceleration. Palisades, NY: NASA Socioeconomic Data and Applications Center (SEDAC). https://doi.org/10.7927/H4BZ63ZS.
Recent Nearby Earthquakes
Magnitude 3.0 and greater
| Date▼ | Time↕ | Magnitude↕ | Distance↕ | Depth↕ | Location↕ | Link |
|---|---|---|---|---|---|---|
| 6/16/19 | 5:25 PM | 4.9 | 83.2 km | 89,840 m | 19km N of Nuevo Churumuco, Mexico | usgs.gov |
| 11/30/17 | 1:43 PM | 4.1 | 90.8 km | 63,880 m | 10km N of Nuevo Churumuco, Mexico | usgs.gov |
| 10/4/17 | 3:16 AM | 4.3 | 87.5 km | 20,780 m | 8km SSE of Tepalcatepec, Mexico | usgs.gov |
| 11/15/14 | 2:02 PM | 4.1 | 91 km | 87,250 m | 22km ESE of La Mira Tumbiscatio, Mexico | usgs.gov |
| 5/26/14 | 3:24 PM | 4.5 | 91.2 km | 72,420 m | 30km SSE of Puruaran, Mexico | usgs.gov |
| 5/7/14 | 7:15 AM | 4.1 | 85.3 km | 20,000 m | 12km ESE of La Mira Tumbiscatio, Mexico | usgs.gov |
| 9/15/12 | 11:02 PM | 4 | 86.8 km | 7,800 m | Michoacan, Mexico | usgs.gov |
| 11/19/11 | 3:46 AM | 4.4 | 96 km | 60,000 m | Michoacan, Mexico | usgs.gov |
| 9/8/11 | 8:15 PM | 4.1 | 88.2 km | 64,400 m | Michoacan, Mexico | usgs.gov |
| 4/2/11 | 2:55 PM | 4.2 | 32.1 km | 114,000 m | Michoacan, Mexico | usgs.gov |
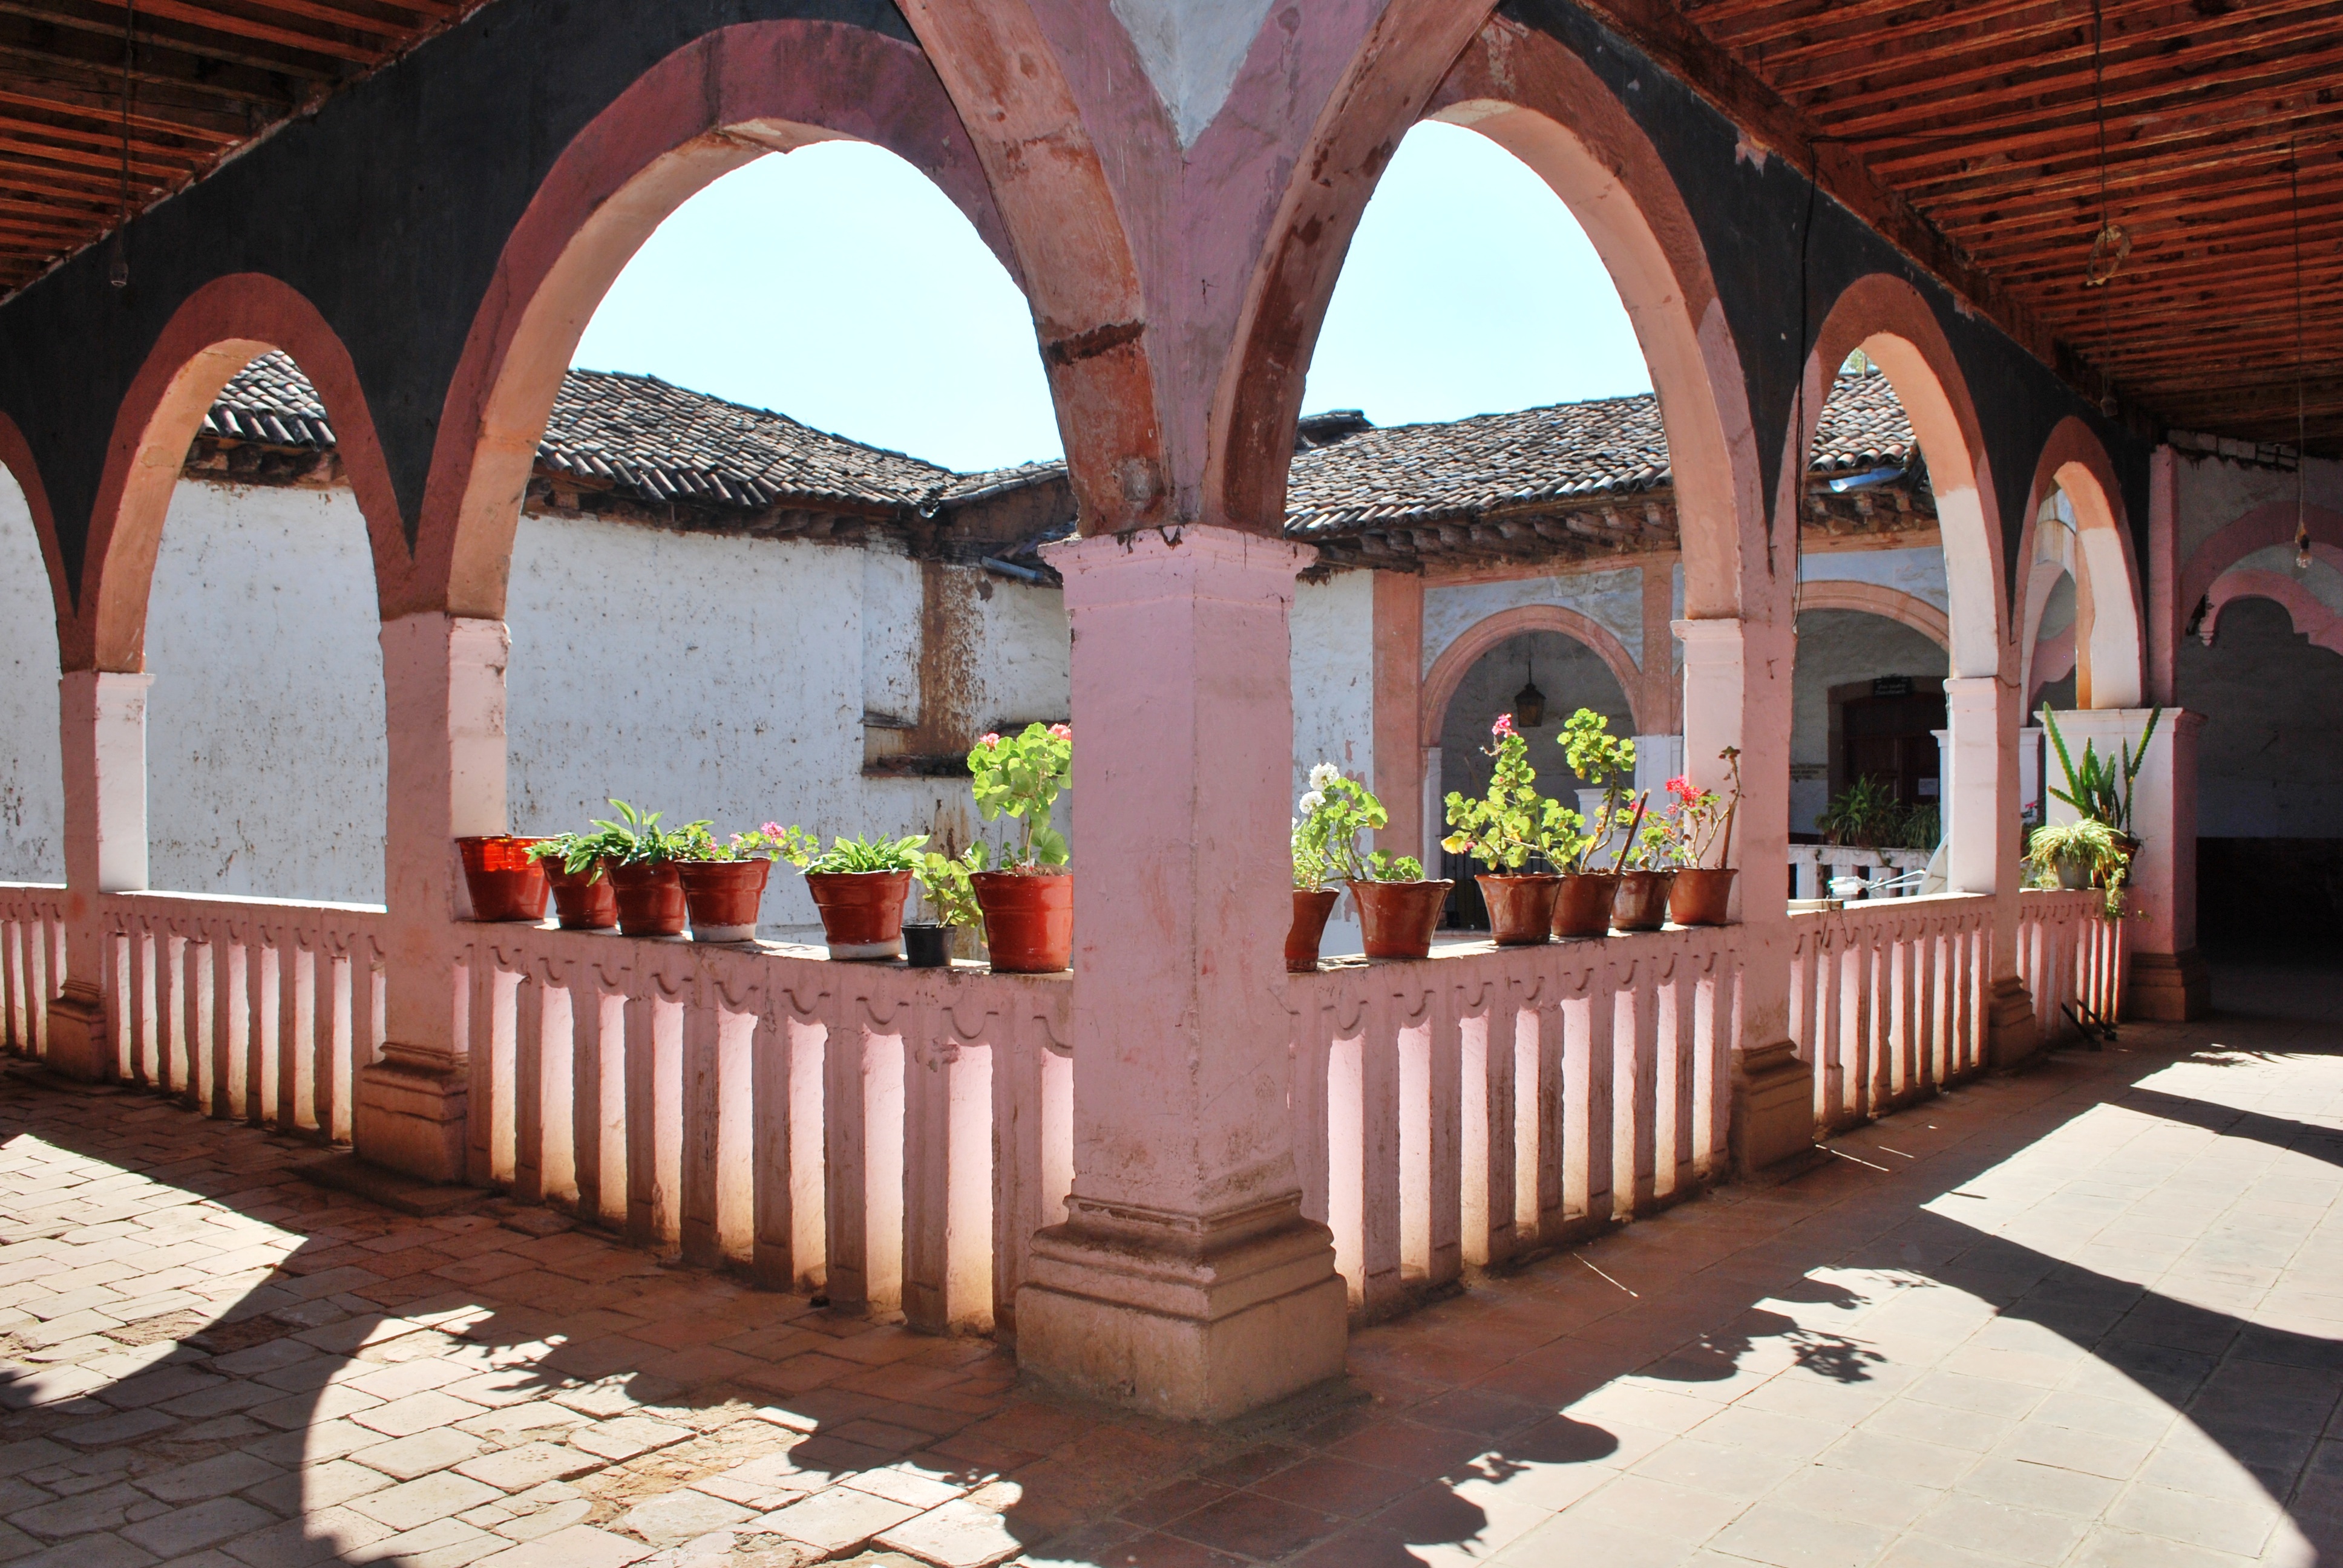
Uruapan
Uruapan is the second largest city in the Mexican state of Michoacán. It is located at the western edge of the Purépecha highlands, just to the east of the Tierra Caliente Region. Since the colonial period, it has been an important city economically ..
Uruapan Wikipedia Page


About Our Data
The data on this page is estimated using a number of publicly available tools and resources. It is provided without warranty, and could contain inaccuracies. Use at your own risk.