Industries
Business Distribution by Industry in Bekok
| Industry Description | Number of Establishments |
|---|---|
| Shopping | 16 |
| Restaurants | 14 |
Bekok Facts
| Area | 6.1 km² |
| Population | 3,059 |
| Male Population | 1,670 (54.6%) |
| Female Population | 1,389 (45.4%) |
| Population change (1975 to 2020) | -5.1% |
| Population change (2000 to 2020) | -12.8% |
| Median Age | 31.7 years (Male: 31.5, Female: 32) |
| Area Codes | 7 |
| Neighborhoods | Kampung Bekok, Kampung Kahang Selatan, Bekok |
| Local Time | |
| Timezone | Malaysia Time |
| Lat & Lng | 2.29720, 103.13020 |
| Postal Codes | 86500 |
Map of Bekok
Interactive Map
Bekok Population
Years 1975 to 2020
| Data | 1975 | 1990 | 2000 | 2015 | 2020 |
|---|---|---|---|---|---|
| Population | 3,223 | 3,743 | 3,507 | 2,834 | 3,059 |
| Population Density | 531.6 / km² | 617.4 / km² | 578.5 / km² | 467.5 / km² | 504.6 / km² |
Bekok Population change from 2000 to 2015
Decrease of 19.2% from year 2000 to 2015
| Location | Change since 1975 | Change since 1990 | Change since 2000 |
|---|---|---|---|
| Bekok | -12.1% | -24.3% | -19.2% |
| Johor | +137.8% | +65.5% | +29.8% |
| Malaysia | +145.8% | +66.5% | +29.4% |
Bekok Median Age
Median Age: 31.7 years
| Location | Median Age | Median Age (Female) | Median Age (Male) |
|---|---|---|---|
| Bekok | 31.7 yrs | 32 yrs | 31.5 yrs |
| Johor | 26.6 yrs | 26.5 yrs | 26.6 yrs |
| Malaysia | 25.7 yrs | 25.7 yrs | 25.8 yrs |
Bekok Population Density
Population Density: 505 / km²
| Location | Population | Area | Density |
|---|---|---|---|
| Bekok | 3,059 | 6.1 km² | 505 / km² |
| Johor | 3.5 million | 18,988.3 km² | 182 / km² |
| Malaysia | 29.6 million | 329,840.2 km² | 89.7 / km² |
Bekok Historical and Projected Population
Estimated Population from 800 to 2100
- JRC (European Commission's Joint Research Centre) work on the GHS built-up grid
- CIESIN (Center for International Earth Science Information Network)
- [Link] Klein Goldewijk, K., Beusen, A., Doelman, J., and Stehfest, E.: Anthropogenic land use estimates for the Holocene – HYDE 3.2, Earth Syst. Sci. Data, 9, 927–953, https://doi.org/10.5194/essd-9-927-2017, 2017.
Neighborhoods in Bekok
Percentage of businesses by neighborhood in Bekok
Area Codes
Percentage Area Codes used by businesses in Bekok
Postal Codes
Percentage of businesses by Postal Codes in Bekok
Price Distribution
Business distribution by price for Bekok
Human Development Index (HDI)
Statistic composite index of life expectancy, education, and per capita income.
Bekok CO2 Emissions
Carbon Dioxide (CO2) Emissions Per Capita in Tonnes Per Year
| Location | CO2 Emissions | CO2 Emissions Per Capita | CO2 Emissions Intensity |
|---|---|---|---|
| Bekok | 22,591 tn | 7.39 tn | 3,726.4 tons/km² |
| Johor | 25,270,859 tn | 7.3 tn | 1,330.9 tons/km² |
| Malaysia | 198,593,412 tn | 6.71 tn | 602.1 tons/km² |
| 2013 CO2 emissions (tonnes/year) | 22,591 tn |
| 2013 CO2 emissions (tonnes/year) per capita | 7.39 tn |
| 2013 CO2 emissions intensity (tonnes/km²/year) | 3,726.4 tons/km² |
Natural Hazards Risk
Relative risk out of 10
| Hazard | Risk Level |
|---|---|
| Flood | High (10) |
| Earthquake | Low (2) |
| Landslide | Medium (6) |
* Risk, particularly concerning flood or landslide, may not be for the entire area.
- Dilley, M., R.S. Chen, U. Deichmann, A.L. Lerner-Lam, M. Arnold, J. Agwe, P. Buys, O. Kjekstad, B. Lyon, and G. Yetman. 2005. Natural Disaster Hotspots: A Global Risk Analysis. Washington, D.C.: World Bank. https://doi.org/10.1596/0-8213-5930-4.
- Center for Hazards and Risk Research - CHRR - Columbia University, Center for International Earth Science Information Network - CIESIN - Columbia University, and Norwegian Geotechnical Institute - NGI. 2005. Global Landslide Hazard Distribution. Palisades, NY: NASA Socioeconomic Data and Applications Center (SEDAC). https://doi.org/10.7927/H4P848VZ.
- Center for Hazards and Risk Research - CHRR - Columbia University, Center for International Earth Science Information Network - CIESIN - Columbia University. 2005. Global Flood Hazard Frequency and Distribution. Palisades, NY: NASA Socioeconomic Data and Applications Center (SEDAC). https://doi.org/10.7927/H4668B3D.
- Center for Hazards and Risk Research - CHRR - Columbia University, Center for International Earth Science Information Network - CIESIN - Columbia University. 2005. Global Earthquake Hazard Distribution - Peak Ground Acceleration. Palisades, NY: NASA Socioeconomic Data and Applications Center (SEDAC). https://doi.org/10.7927/H4BZ63ZS.
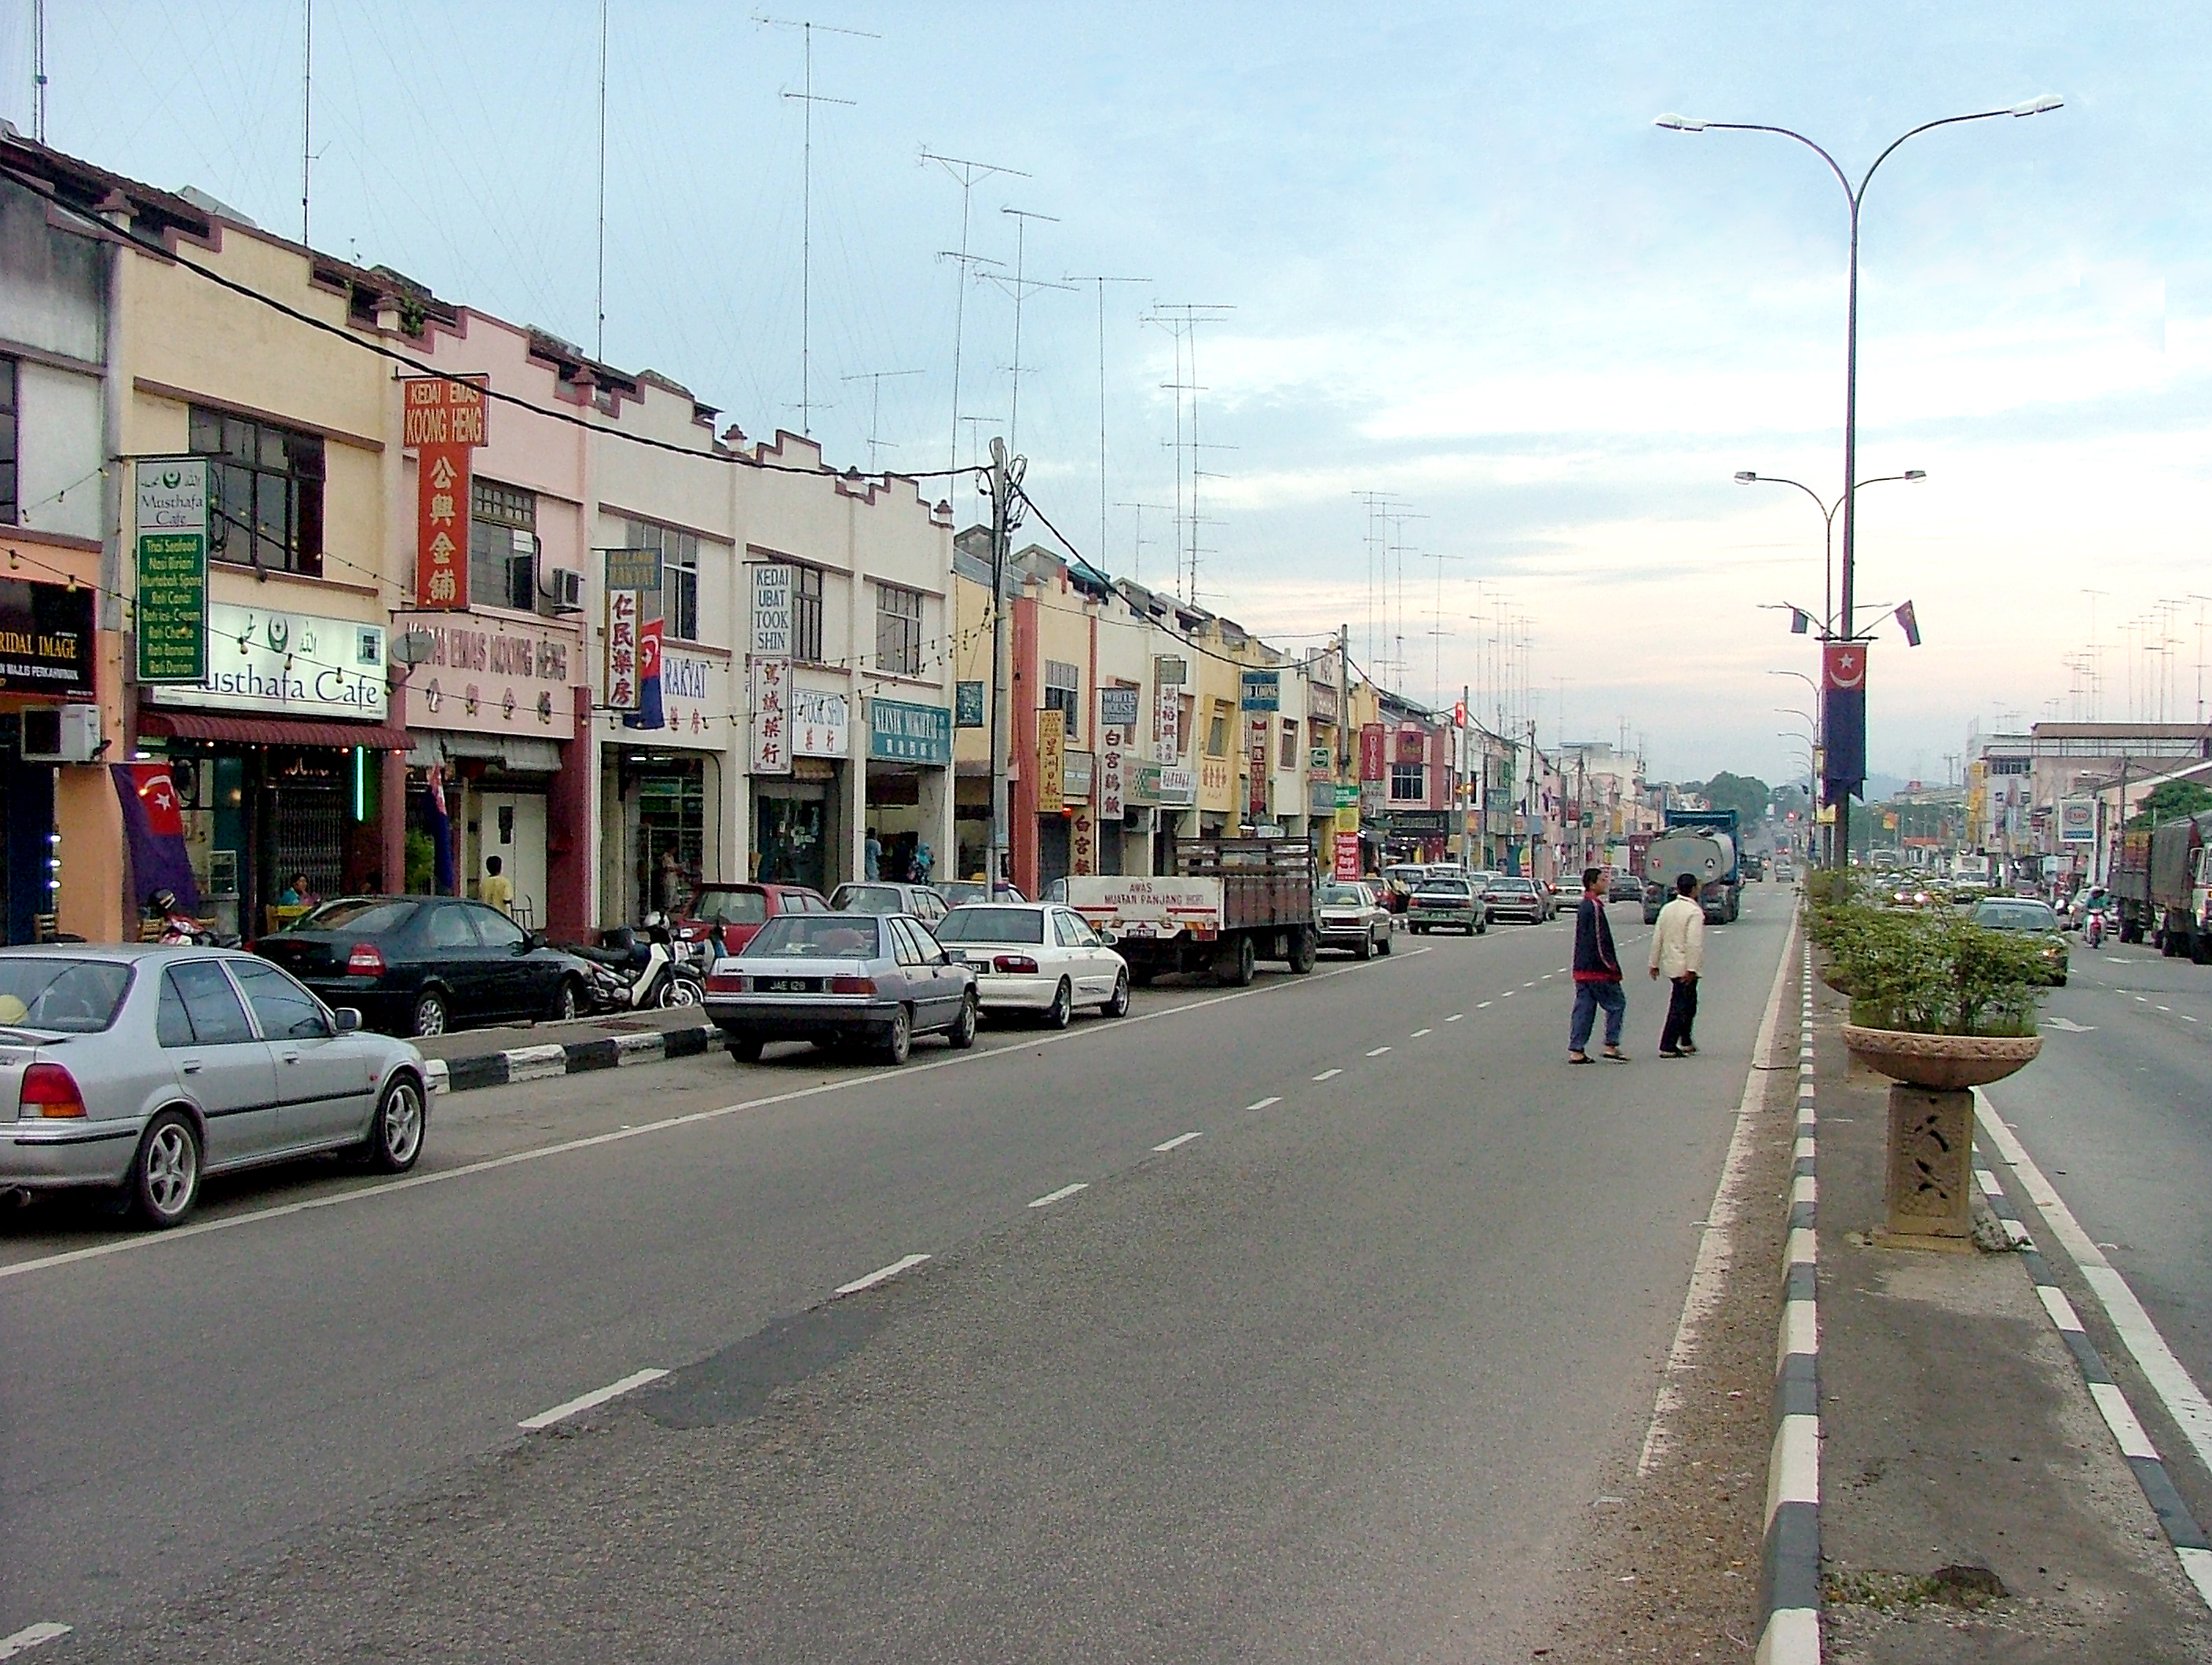
Bekok
Bekok is a town located at the eastern side of Segamat District, Johor, Malaysia. Bekok is well-known especially among nature lovers since Bekok is the western entrance to Endau Rompin National Park as well as having a refreshing waterfall known as S..
Bekok Wikipedia Page


About Our Data
The data on this page is estimated using a number of publicly available tools and resources. It is provided without warranty, and could contain inaccuracies. Use at your own risk.