Categories in Bongawan
Industries
Business Distribution by Industry in Bongawan
| Industry Description | Number of Establishments |
|---|---|
| Restaurants | 40 |
| Shopping | 29 |
| Education | 29 |
| Other membership organizations | 24 |
| Grocery stores and supermarkets | 23 |
| Other accommodation | 21 |
| Cafes | 18 |
| Mosques | 18 |
| Clothing stores | 10 |
| Bakeries | 10 |
| Travel and transportation | 9 |
Bongawan Facts
| Area | 27.3 km² |
| Population | 5,957 |
| Male Population | 3,125 (52.5%) |
| Female Population | 2,832 (47.5%) |
| Population change (1975 to 2020) | +173.1% |
| Population change (2000 to 2020) | +34.7% |
| Median Age | 22.7 years (Male: 22.8, Female: 22.5) |
| Area Codes | 87 |
| Neighborhoods | Pekan Bongawan, Bongawan, Kampung Mawao |
| Local Time | |
| Timezone | Malaysia Time |
| Lat & Lng | 5.53333, 115.85000 |
| Postal Codes | 89700, 89707, 89708, 89709 |
Map of Bongawan
Interactive Map
Bongawan Population
Years 1975 to 2020
| Data | 1975 | 1990 | 2000 | 2015 | 2020 |
|---|---|---|---|---|---|
| Population | 2,181 | 3,209 | 4,422 | 5,594 | 5,957 |
| Population Density | 79.9 / km² | 117.5 / km² | 161.9 / km² | 204.8 / km² | 218.1 / km² |
Bongawan Population change from 2000 to 2015
Increase of 26.5% from year 2000 to 2015
| Location | Change since 1975 | Change since 1990 | Change since 2000 |
|---|---|---|---|
| Bongawan | +156.5% | +74.3% | +26.5% |
| Sabah | +319.5% | +127.4% | +54.1% |
| Malaysia | +145.8% | +66.5% | +29.4% |
Bongawan Median Age
Median Age: 22.7 years
| Location | Median Age | Median Age (Female) | Median Age (Male) |
|---|---|---|---|
| Bongawan | 22.7 yrs | 22.5 yrs | 22.8 yrs |
| Sabah | 22.6 yrs | 22.4 yrs | 22.7 yrs |
| Malaysia | 25.7 yrs | 25.7 yrs | 25.8 yrs |
Bongawan Population Density
Population Density: 218 / km²
| Location | Population | Area | Density |
|---|---|---|---|
| Bongawan | 5,957 | 27.3 km² | 218 / km² |
| Sabah | 3.4 million | 74,248.4 km² | 45.4 / km² |
| Malaysia | 29.6 million | 329,840.2 km² | 89.7 / km² |
Bongawan Historical and Projected Population
Estimated Population from 1810 to 2100
- JRC (European Commission's Joint Research Centre) work on the GHS built-up grid
- CIESIN (Center for International Earth Science Information Network)
- [Link] Klein Goldewijk, K., Beusen, A., Doelman, J., and Stehfest, E.: Anthropogenic land use estimates for the Holocene – HYDE 3.2, Earth Syst. Sci. Data, 9, 927–953, https://doi.org/10.5194/essd-9-927-2017, 2017.
Neighborhoods in Bongawan
Percentage of businesses by neighborhood in Bongawan
Area Codes
Percentage Area Codes used by businesses in Bongawan
Postal Codes
Percentage of businesses by Postal Codes in Bongawan
Price Distribution
Business distribution by price for Bongawan
Human Development Index (HDI)
Statistic composite index of life expectancy, education, and per capita income.
Bongawan CO2 Emissions
Carbon Dioxide (CO2) Emissions Per Capita in Tonnes Per Year
| Location | CO2 Emissions | CO2 Emissions Per Capita | CO2 Emissions Intensity |
|---|---|---|---|
| Bongawan | 38,246 tn | 6.42 tn | 1,400.3 tons/km² |
| Sabah | 21,232,731 tn | 6.3 tn | 286 tons/km² |
| Malaysia | 198,593,412 tn | 6.71 tn | 602.1 tons/km² |
| 2013 CO2 emissions (tonnes/year) | 38,246 tn |
| 2013 CO2 emissions (tonnes/year) per capita | 6.42 tn |
| 2013 CO2 emissions intensity (tonnes/km²/year) | 1,400.3 tons/km² |
Natural Hazards Risk
Relative risk out of 10
| Hazard | Risk Level |
|---|---|
| Drought | Low (2) |
| Earthquake | Low (2.2) |
* Risk, particularly concerning flood or landslide, may not be for the entire area.
- Dilley, M., R.S. Chen, U. Deichmann, A.L. Lerner-Lam, M. Arnold, J. Agwe, P. Buys, O. Kjekstad, B. Lyon, and G. Yetman. 2005. Natural Disaster Hotspots: A Global Risk Analysis. Washington, D.C.: World Bank. https://doi.org/10.1596/0-8213-5930-4.
- Center for Hazards and Risk Research - CHRR - Columbia University, Center for International Earth Science Information Network - CIESIN - Columbia University, and International Research Institute for Climate and Society - IRI - Columbia University. 2005. Global Drought Hazard Frequency and Distribution. Palisades, NY: NASA Socioeconomic Data and Applications Center (SEDAC). https://doi.org/10.7927/H4VX0DFT.
- Center for Hazards and Risk Research - CHRR - Columbia University, Center for International Earth Science Information Network - CIESIN - Columbia University. 2005. Global Earthquake Hazard Distribution - Peak Ground Acceleration. Palisades, NY: NASA Socioeconomic Data and Applications Center (SEDAC). https://doi.org/10.7927/H4BZ63ZS.
Recent Nearby Earthquakes
Magnitude 3.0 and greater
| Date▼ | Time↕ | Magnitude↕ | Distance↕ | Depth↕ | Location↕ | Link |
|---|---|---|---|---|---|---|
| 6/4/15 | 11:15 PM | 6 | 91.5 km | 10,000 m | 14km WNW of Ranau, Malaysia | usgs.gov |
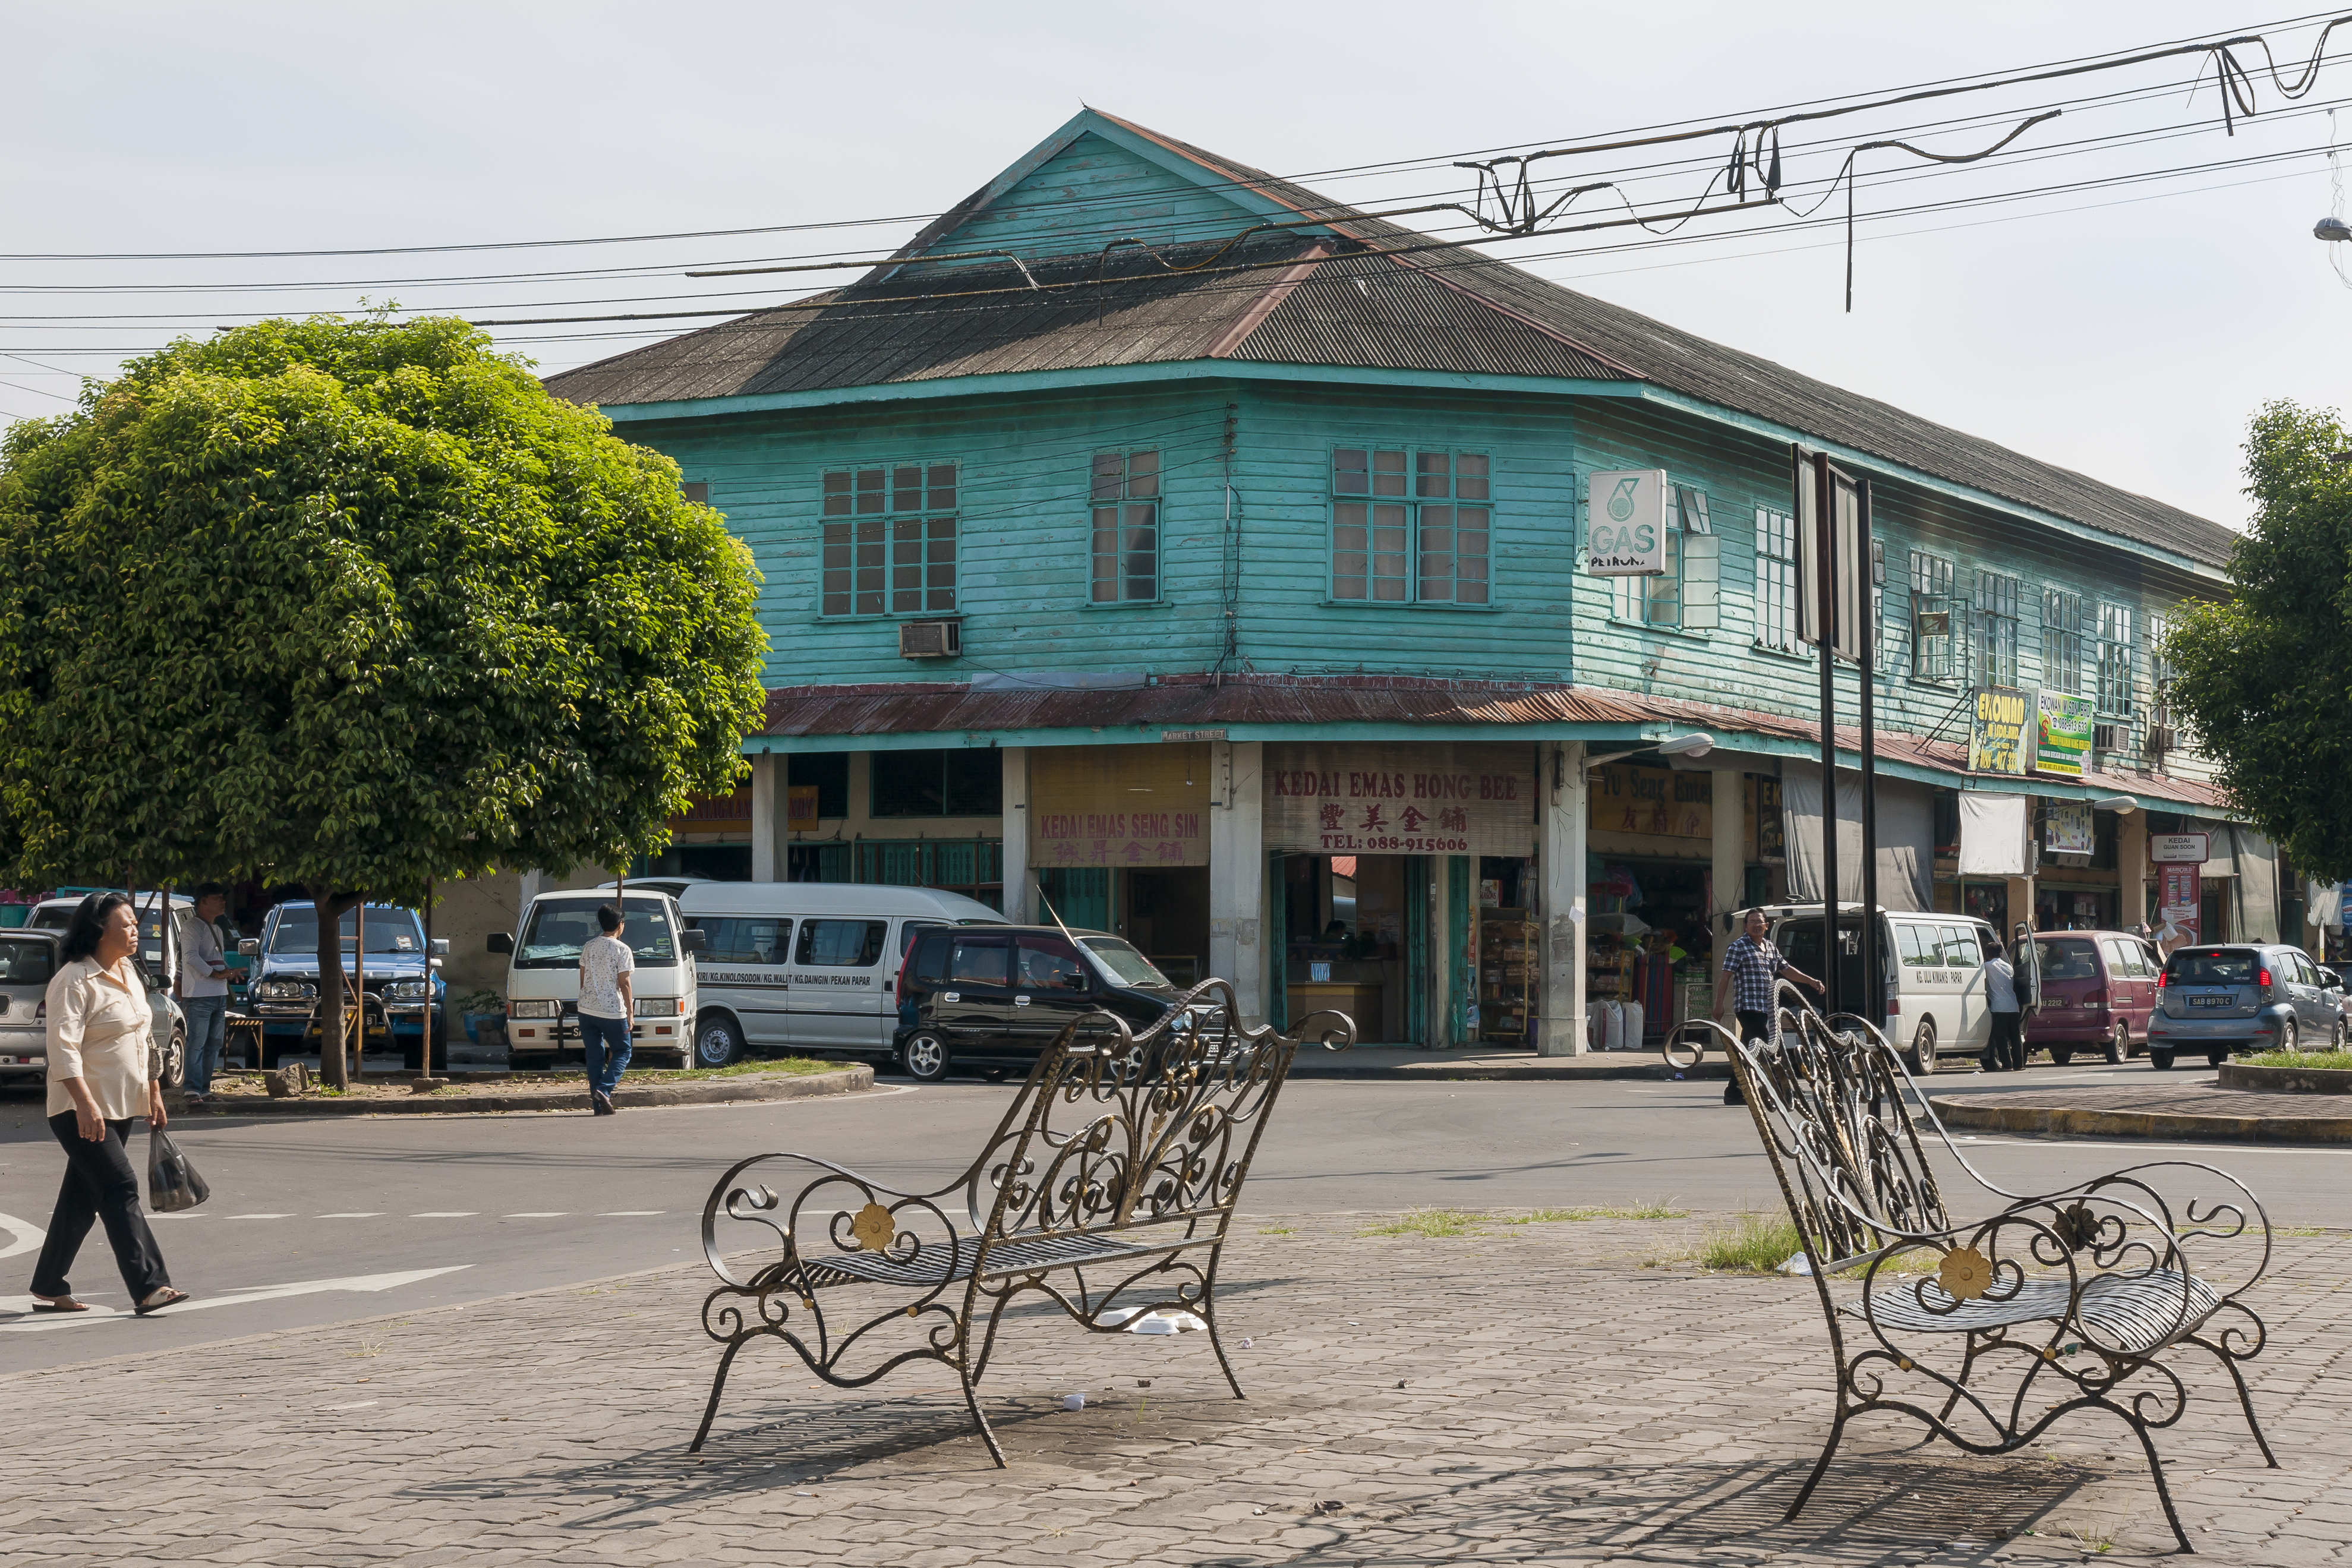
Bongawan
Bongawan is a town in the West Coast Division of the state of Sabah in Malaysia. It is situated within the parliamentary constituency of Kimanis. The town centre is 3 kilometres inland from the South China Sea and approximately 60 kilometres south of..
Bongawan Wikipedia Page

About Our Data
The data on this page is estimated using a number of publicly available tools and resources. It is provided without warranty, and could contain inaccuracies. Use at your own risk.