Categories in Limbang
Industries
Business Distribution by Industry in Limbang
| Industry Description | Number of Establishments |
|---|---|
| Restaurants | 118 |
| Shopping | 79 |
| Education | 58 |
| Public administration | 48 |
| Cafes | 42 |
| Mosques | 37 |
| Grocery stores and supermarkets | 33 |
| Car repair | 27 |
| Other accommodation | 26 |
| Churches | 25 |
| Corporate management | 24 |
| Travel and transportation | 22 |
| Religion | 21 |
| Electronics stores | 20 |
Limbang Facts
| Area | 74.9 km² |
| Population | 41,224 |
| Male Population | 21,112 (51.2%) |
| Female Population | 20,112 (48.8%) |
| Population change (1975 to 2020) | +112.9% |
| Population change (2000 to 2020) | +22.4% |
| Median Age | 24.1 years (Male: 24.7, Female: 23.5) |
| Area Codes | 85, 8521 |
| Neighborhoods | Pekan Limbang, Limbang, Sarawak, Kubong Industrial Estate, Junction Of Jalan Buangsiol Off Jalan Bangkita |
| Local Time | |
| Timezone | Malaysia Time |
| Lat & Lng | 4.75000, 115.00000 |
| Postal Codes | 98700, 98707 |
Map of Limbang
Interactive Map
Limbang Population
Years 1975 to 2020
| Data | 1975 | 1990 | 2000 | 2015 | 2020 |
|---|---|---|---|---|---|
| Population | 19,359 | 27,666 | 33,692 | 38,221 | 41,224 |
| Population Density | 258.3 / km² | 369.2 / km² | 449.6 / km² | 510 / km² | 550.1 / km² |
Limbang Population change from 2000 to 2015
Increase of 13.4% from year 2000 to 2015
| Location | Change since 1975 | Change since 1990 | Change since 2000 |
|---|---|---|---|
| Limbang | +97.4% | +38.2% | +13.4% |
| Sarawak | -85.9% | -72.6% | -56.2% |
| Malaysia | +145.8% | +66.5% | +29.4% |
Limbang Median Age
Median Age: 24.1 years
| Location | Median Age | Median Age (Female) | Median Age (Male) |
|---|---|---|---|
| Limbang | 24.1 yrs | 23.5 yrs | 24.7 yrs |
| Sarawak | 24.9 yrs | 24.4 yrs | 25.5 yrs |
| Malaysia | 25.7 yrs | 25.7 yrs | 25.8 yrs |
Limbang Population Density
Population Density: 550 / km²
| Location | Population | Area | Density |
|---|---|---|---|
| Limbang | 41,224 | 74.9 km² | 550 / km² |
| Sarawak | 32 | 22.3 km² | 1.4 / km² |
| Malaysia | 29.6 million | 329,840.2 km² | 89.7 / km² |
Limbang Historical and Projected Population
Estimated Population from 1780 to 2100
- JRC (European Commission's Joint Research Centre) work on the GHS built-up grid
- CIESIN (Center for International Earth Science Information Network)
- [Link] Klein Goldewijk, K., Beusen, A., Doelman, J., and Stehfest, E.: Anthropogenic land use estimates for the Holocene – HYDE 3.2, Earth Syst. Sci. Data, 9, 927–953, https://doi.org/10.5194/essd-9-927-2017, 2017.
Price Distribution
Business distribution by price for Limbang
Human Development Index (HDI)
Statistic composite index of life expectancy, education, and per capita income.
Limbang CO2 Emissions
Carbon Dioxide (CO2) Emissions Per Capita in Tonnes Per Year
| Location | CO2 Emissions | CO2 Emissions Per Capita | CO2 Emissions Intensity |
|---|---|---|---|
| Limbang | 314,602 tn | 7.63 tn | 4,198.2 tons/km² |
| Sarawak | 125 tn | 3.91 tn | 5.6 tons/km² |
| Malaysia | 198,593,412 tn | 6.71 tn | 602.1 tons/km² |
| 2013 CO2 emissions (tonnes/year) | 314,602 tn |
| 2013 CO2 emissions (tonnes/year) per capita | 7.63 tn |
| 2013 CO2 emissions intensity (tonnes/km²/year) | 4,198.2 tons/km² |
Natural Hazards Risk
Relative risk out of 10
| Hazard | Risk Level |
|---|---|
| Earthquake | Low (2) |
| Landslide | Medium (6) |
* Risk, particularly concerning flood or landslide, may not be for the entire area.
- Dilley, M., R.S. Chen, U. Deichmann, A.L. Lerner-Lam, M. Arnold, J. Agwe, P. Buys, O. Kjekstad, B. Lyon, and G. Yetman. 2005. Natural Disaster Hotspots: A Global Risk Analysis. Washington, D.C.: World Bank. https://doi.org/10.1596/0-8213-5930-4.
- Center for Hazards and Risk Research - CHRR - Columbia University, Center for International Earth Science Information Network - CIESIN - Columbia University, and Norwegian Geotechnical Institute - NGI. 2005. Global Landslide Hazard Distribution. Palisades, NY: NASA Socioeconomic Data and Applications Center (SEDAC). https://doi.org/10.7927/H4P848VZ.
- Center for Hazards and Risk Research - CHRR - Columbia University, Center for International Earth Science Information Network - CIESIN - Columbia University. 2005. Global Earthquake Hazard Distribution - Peak Ground Acceleration. Palisades, NY: NASA Socioeconomic Data and Applications Center (SEDAC). https://doi.org/10.7927/H4BZ63ZS.
Recent Nearby Earthquakes
Magnitude 3.0 and greater
| Date▼ | Time↕ | Magnitude↕ | Distance↕ | Depth↕ | Location↕ | Link |
|---|---|---|---|---|---|---|
| 6/30/05 | 6:09 PM | 4.5 | 83.1 km | 24,700 m | Sarawak-Sabah border region, Malaysia | usgs.gov |
| 2/22/92 | 12:39 AM | 5.2 | 89.1 km | 40,400 m | South China Sea | usgs.gov |
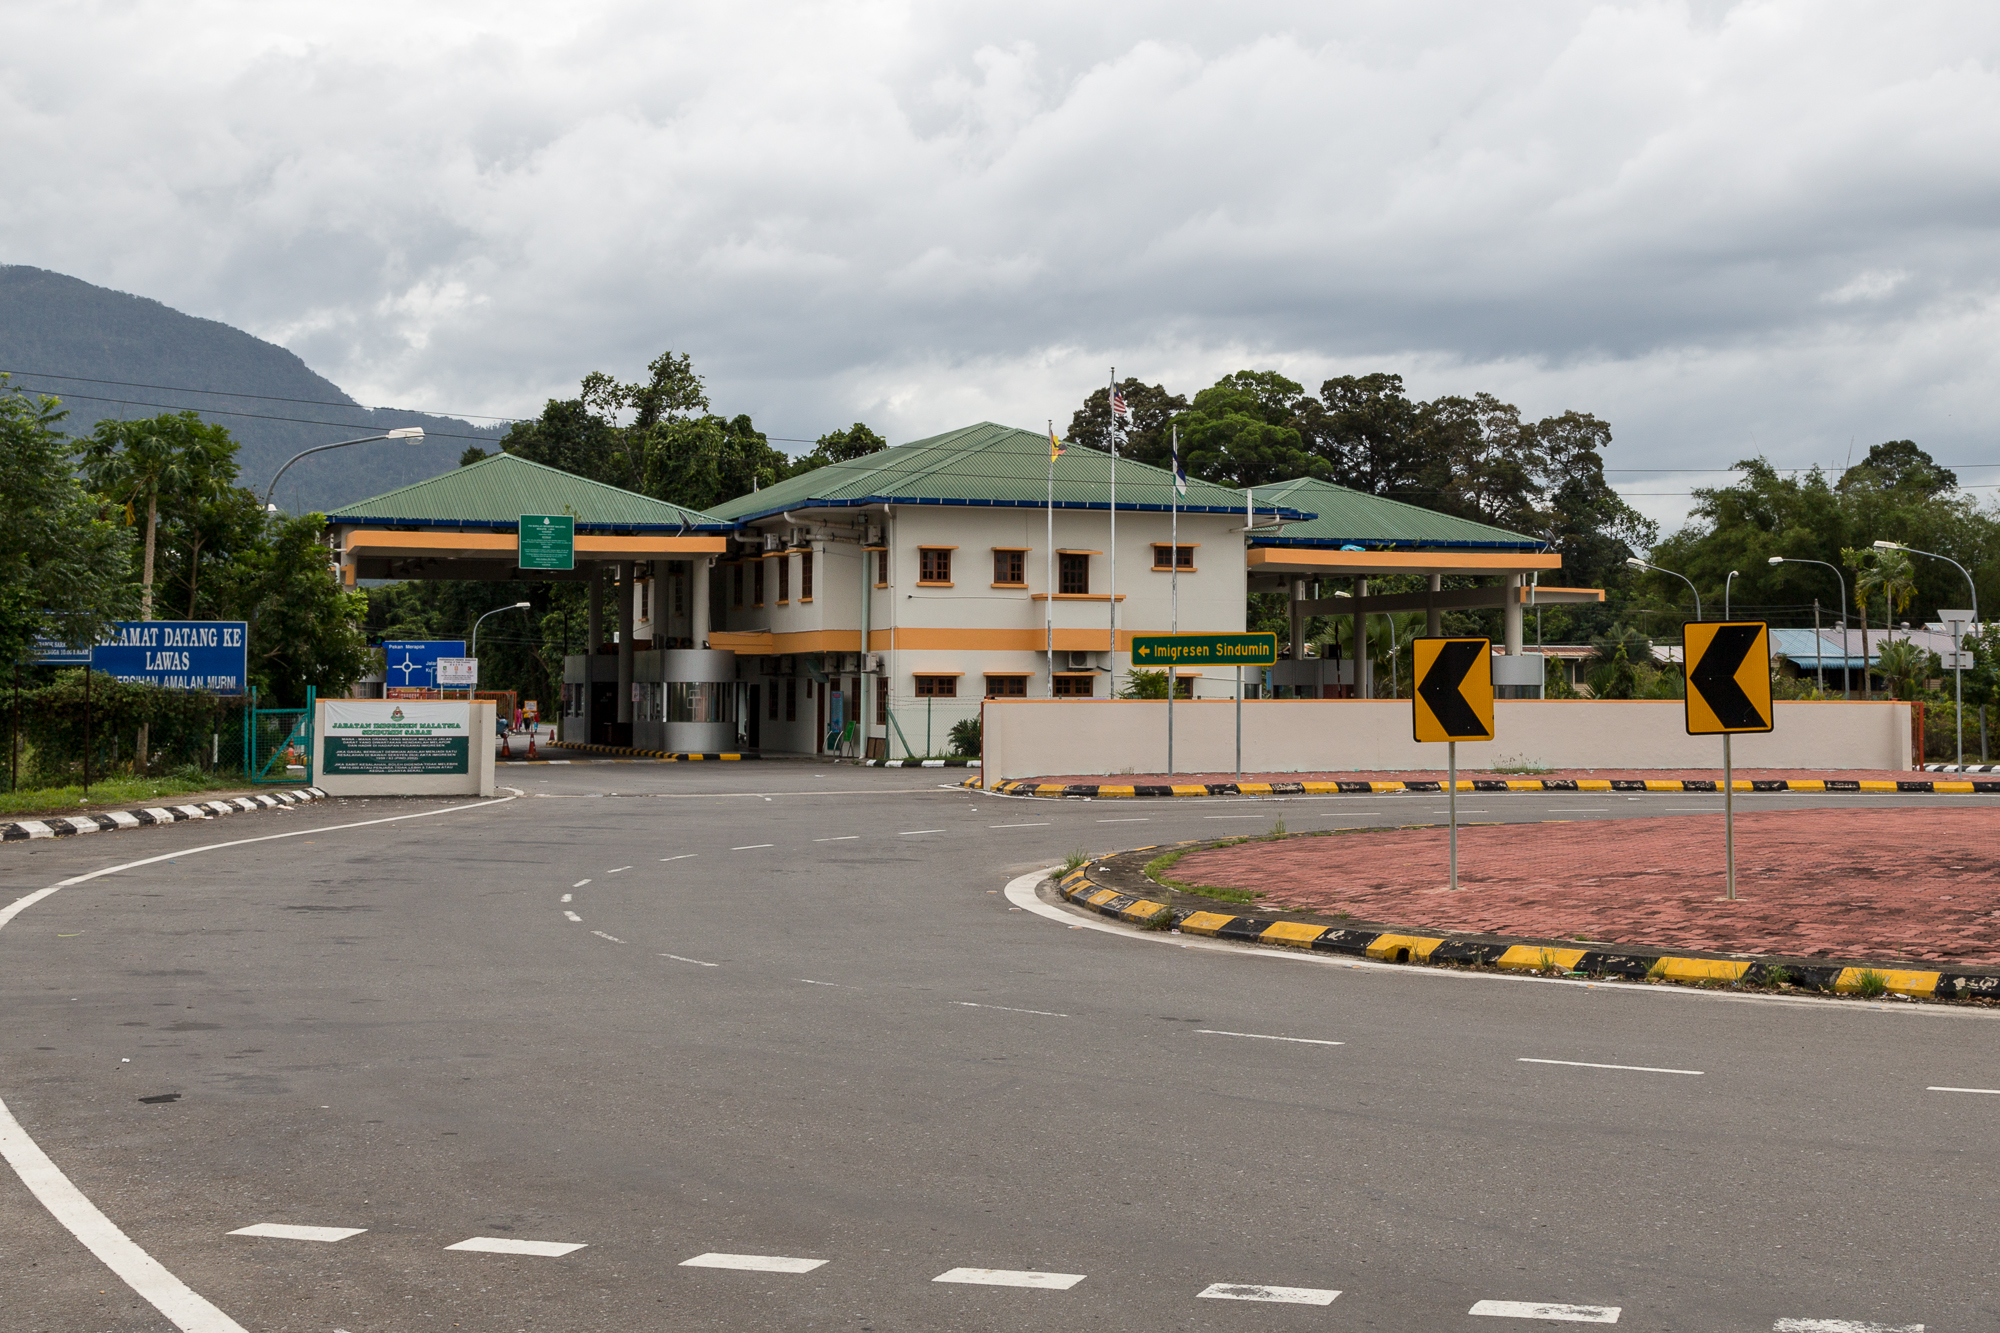
Limbang
Limbang is a border town and the capital of Limbang District in the Limbang Division of northern Sarawak, East Malaysia, on the island of Borneo. The division has an area of 3,978.1 square kilometres, and a population (year 2000 census) of 42,600. i..
Limbang Wikipedia Page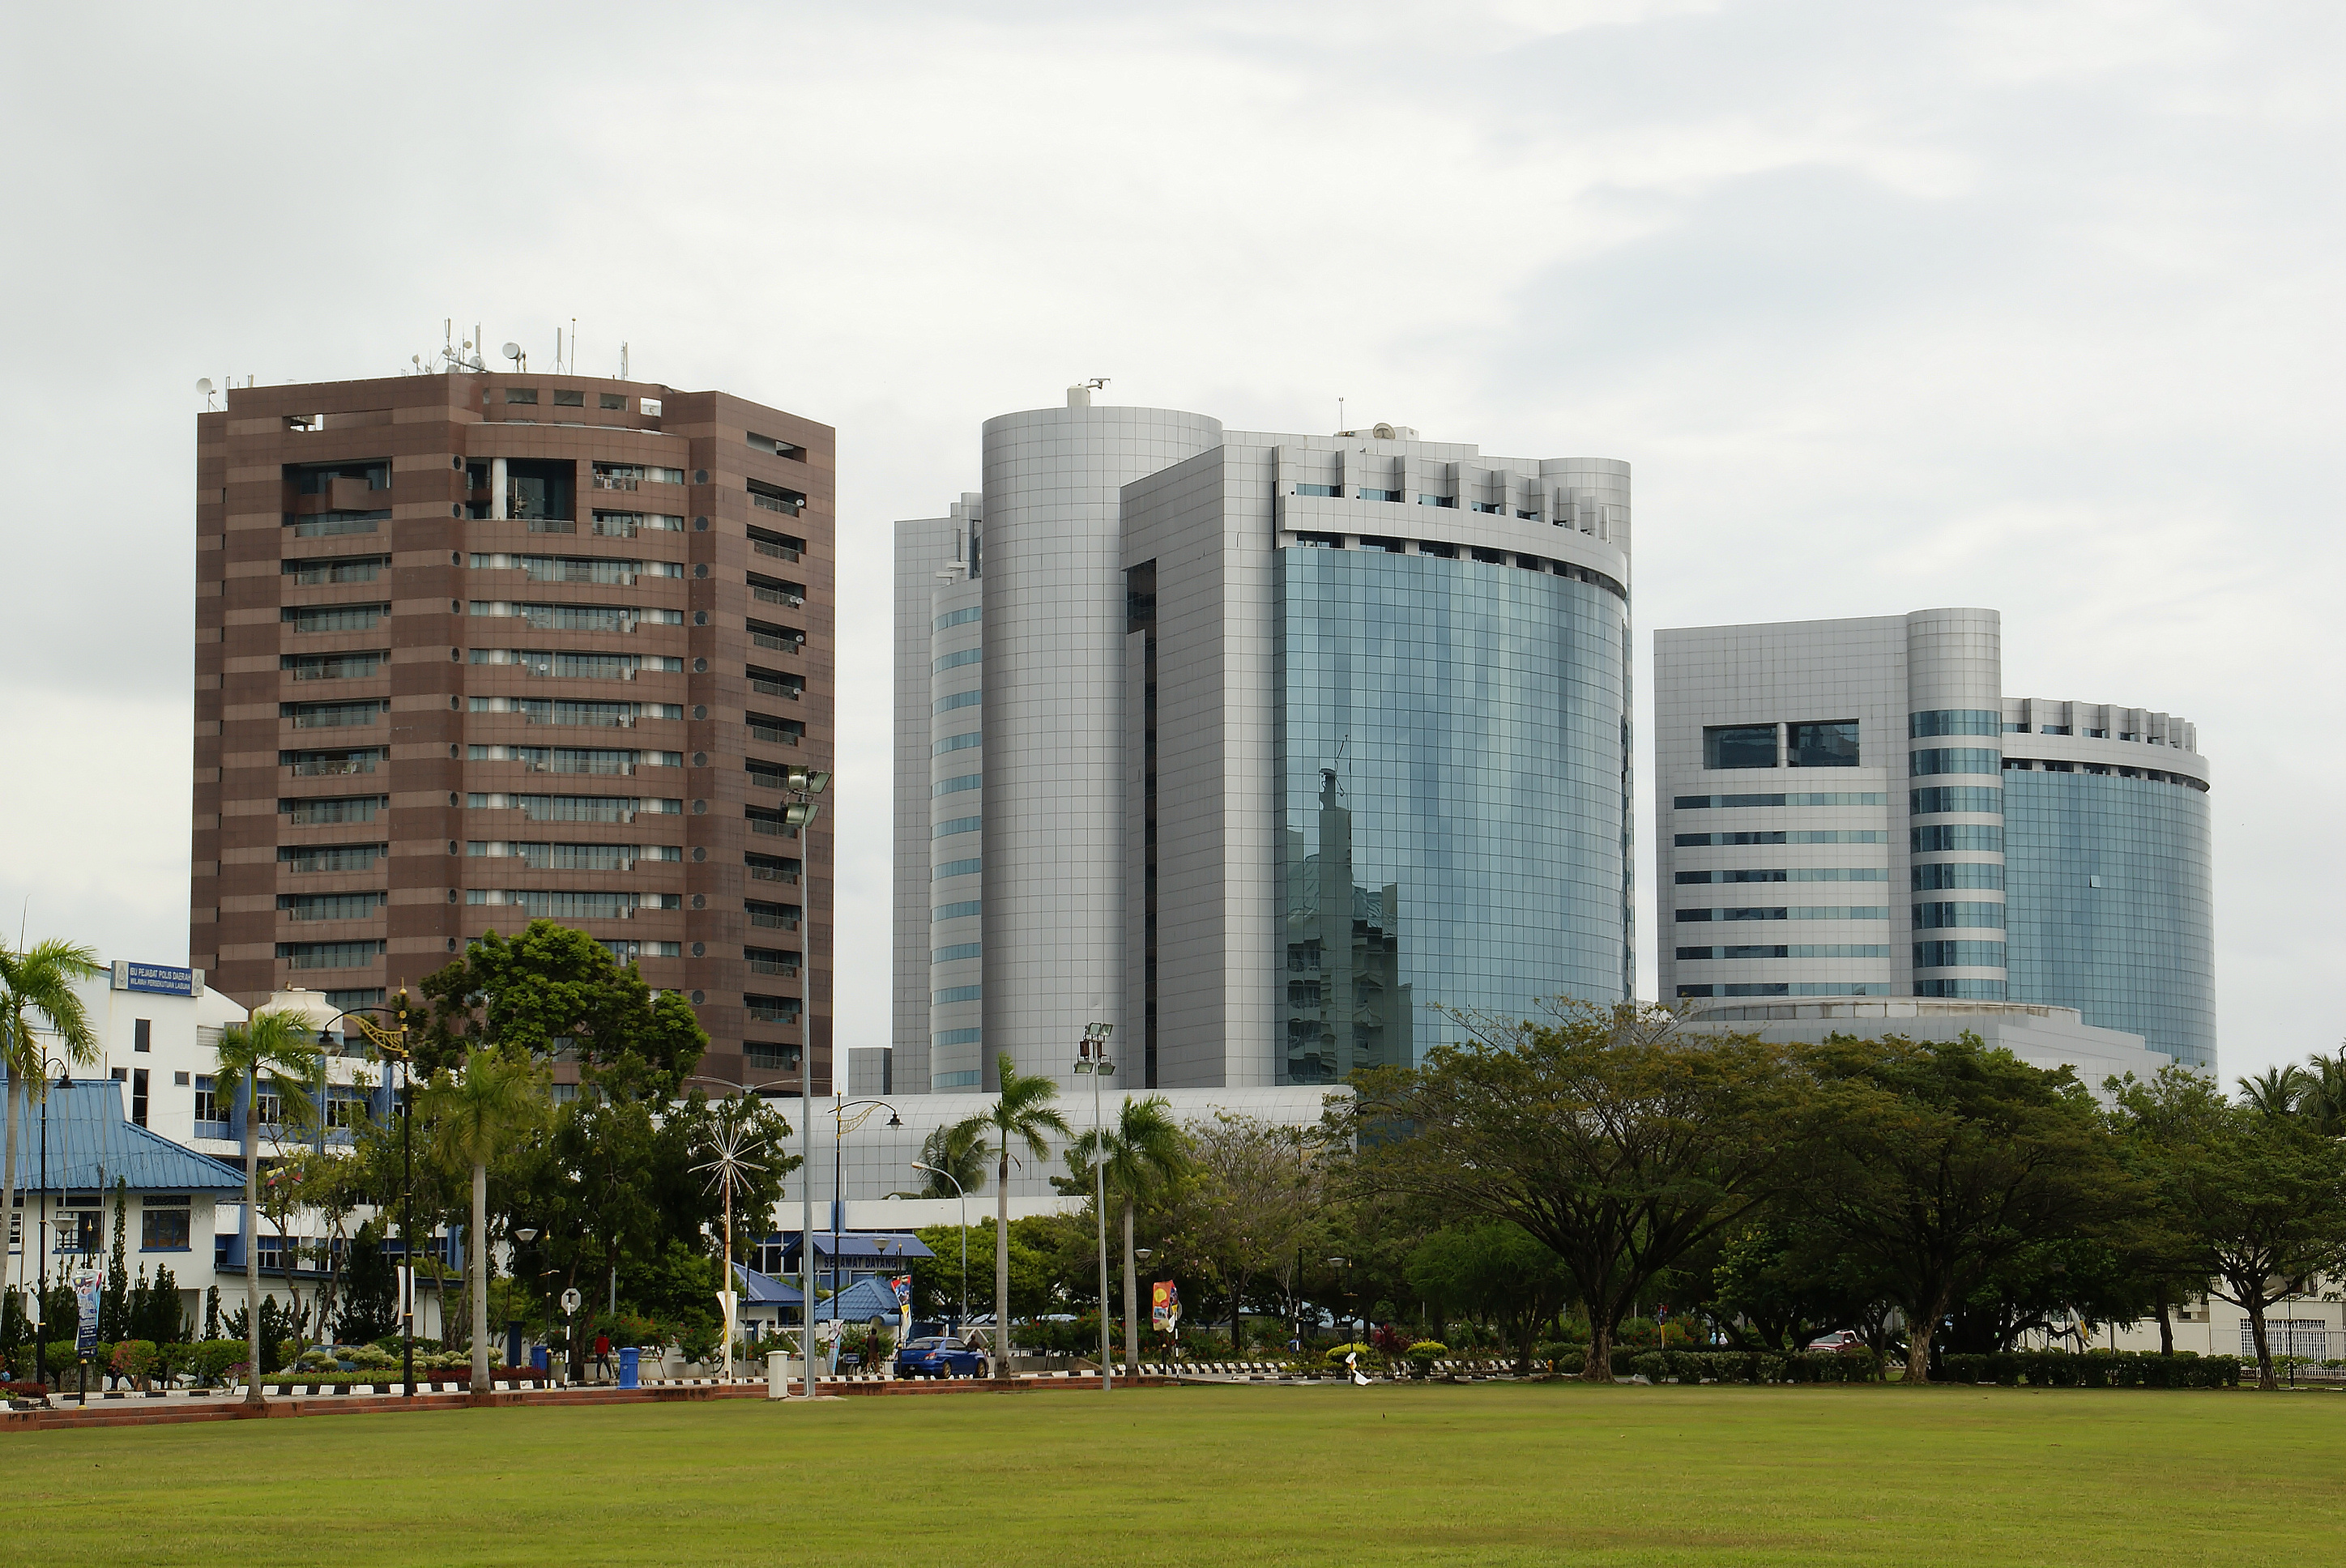

About Our Data
The data on this page is estimated using a number of publicly available tools and resources. It is provided without warranty, and could contain inaccuracies. Use at your own risk.