Categories in Sarikei
Industries
Business Distribution by Industry in Sarikei
| Industry Description | Number of Establishments |
|---|---|
| Restaurants | 171 |
| Cafes | 155 |
| Shopping | 151 |
| Education | 90 |
| Public administration | 65 |
| Car repair | 55 |
| Corporate management | 49 |
| Grocery stores and supermarkets | 47 |
| Hardware store | 39 |
| Beauty salons | 37 |
| Other accommodation | 37 |
| Pharmacies and drug stores | 32 |
| Electronics stores | 32 |
Sarikei Facts
| Area | 49.0 km² |
| Population | 59,246 |
| Male Population | 29,908 (50.5%) |
| Female Population | 29,338 (49.5%) |
| Population change (1975 to 2020) | +72.8% |
| Population change (2000 to 2020) | +15.3% |
| Median Age | 24.1 years (Male: 24.7, Female: 23.5) |
| Area Codes | 84, 8465 |
| Neighborhoods | Bandar Sarikei, Jakar, Sarikei, Sungai Puah, Tiang Soon Height |
| Local Time | |
| Timezone | Malaysia Time |
| Lat & Lng | 2.11667, 111.51667 |
| Postal Codes | 96100, 96107, 96108, 96109 |
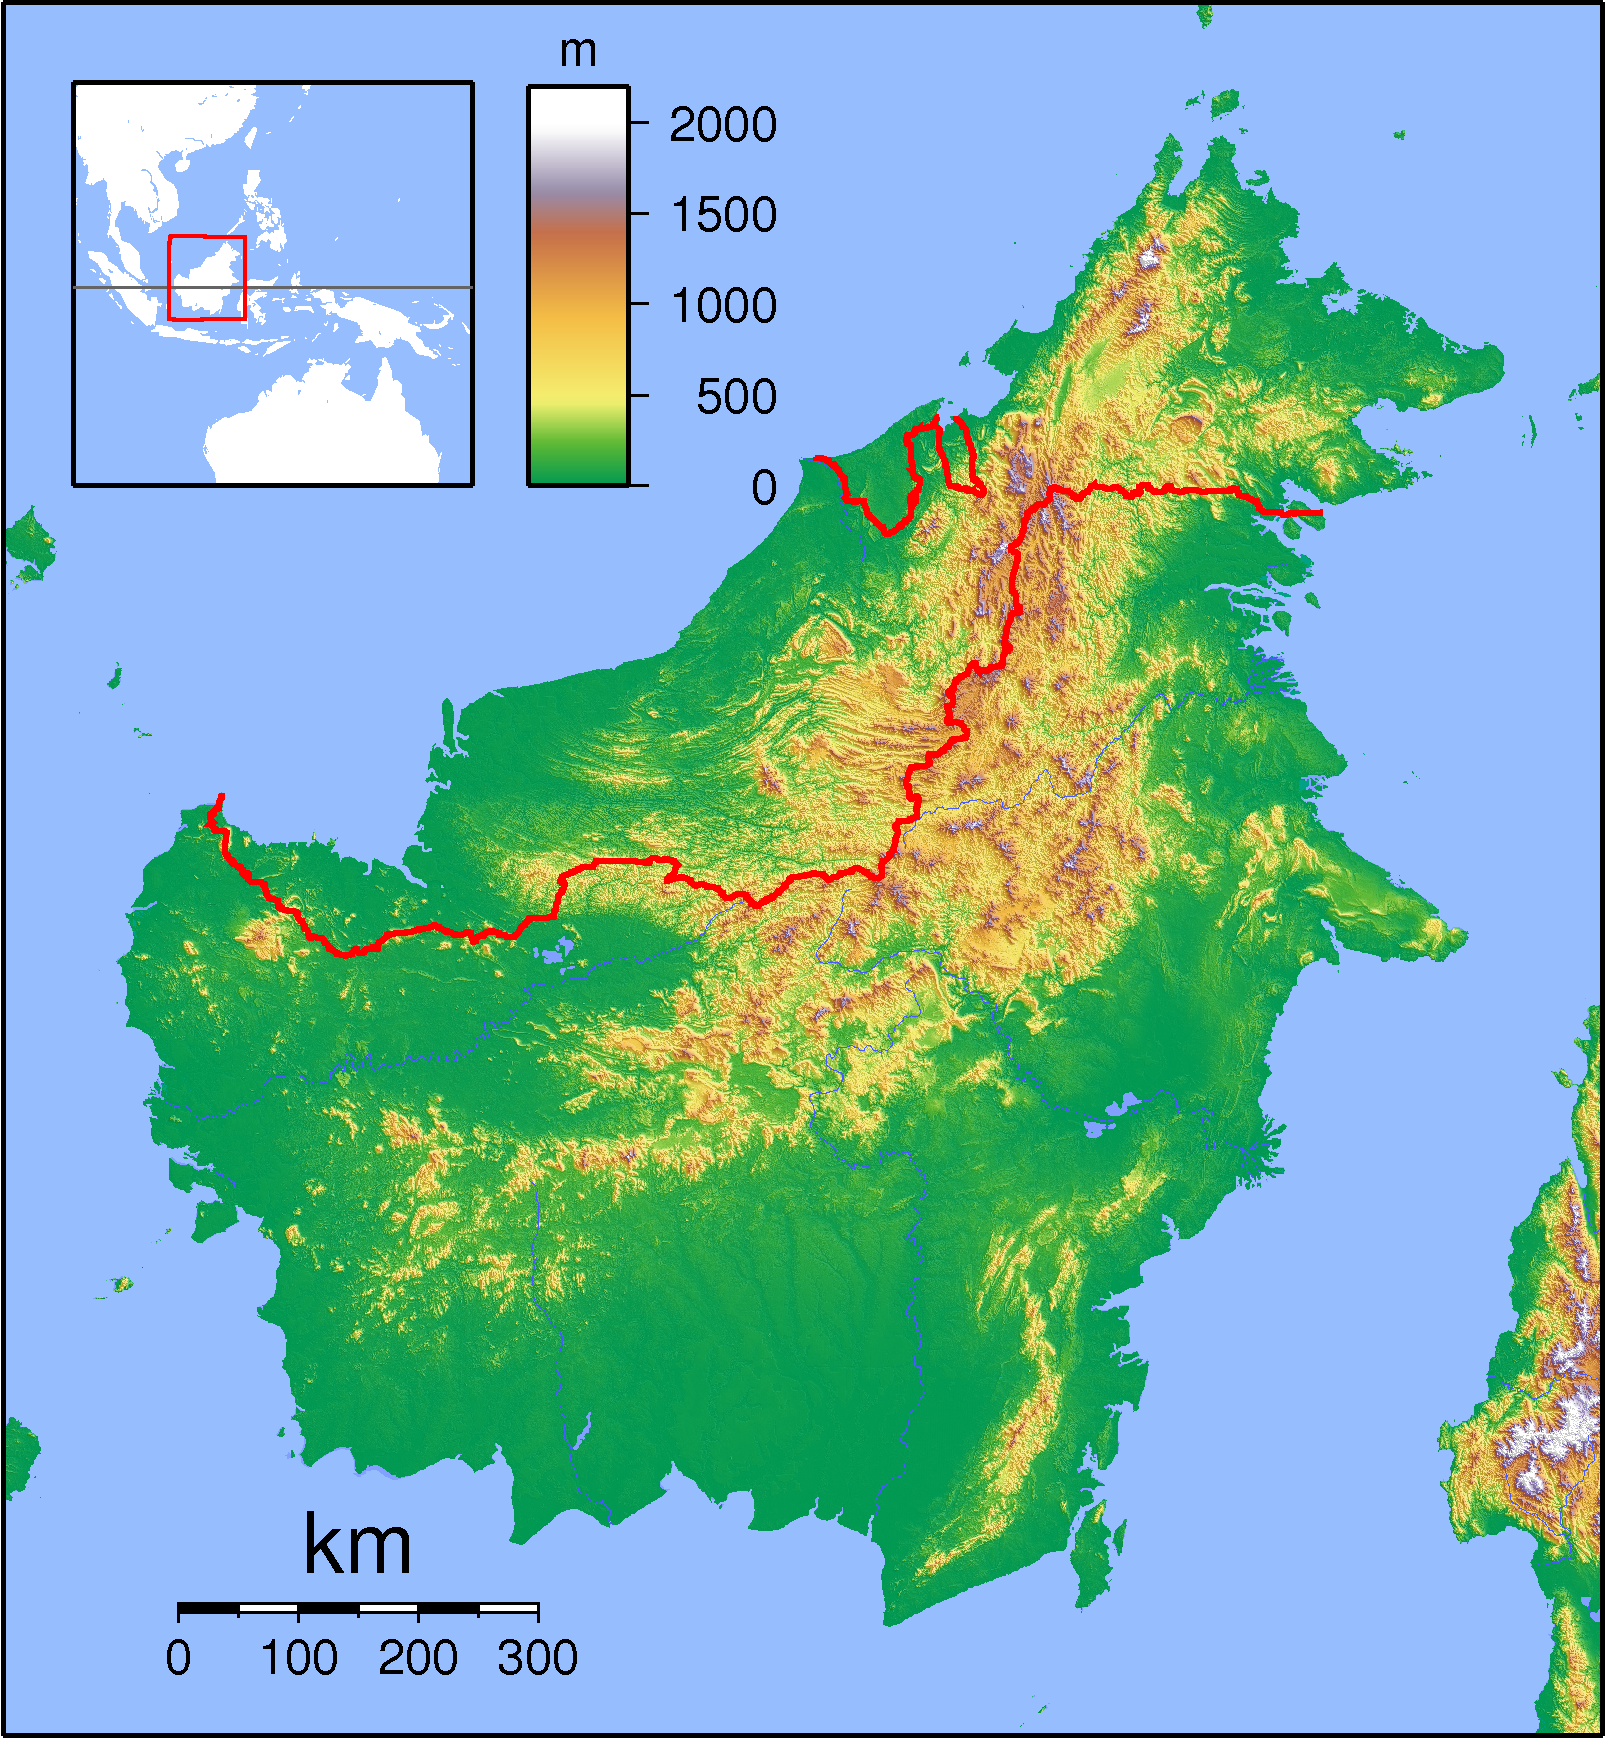
Map of Sarikei
Interactive Map
Sarikei Population
Years 1975 to 2020
| Data | 1975 | 1990 | 2000 | 2015 | 2020 |
|---|---|---|---|---|---|
| Population | 34,290 | 44,397 | 51,393 | 55,048 | 59,246 |
| Population Density | 699.8 / km² | 906.1 / km² | 1,048.8 / km² | 1,123.4 / km² | 1,209.1 / km² |
Sarikei Population change from 2000 to 2015
Increase of 7.1% from year 2000 to 2015
| Location | Change since 1975 | Change since 1990 | Change since 2000 |
|---|---|---|---|
| Sarikei | +60.5% | +24% | +7.1% |
| Sarawak | -85.9% | -72.6% | -56.2% |
| Malaysia | +145.8% | +66.5% | +29.4% |
Sarikei Median Age
Median Age: 24.1 years
| Location | Median Age | Median Age (Female) | Median Age (Male) |
|---|---|---|---|
| Sarikei | 24.1 yrs | 23.5 yrs | 24.7 yrs |
| Sarawak | 24.9 yrs | 24.4 yrs | 25.5 yrs |
| Malaysia | 25.7 yrs | 25.7 yrs | 25.8 yrs |
Sarikei Population Density
Population Density: 1,209 / km²
| Location | Population | Area | Density |
|---|---|---|---|
| Sarikei | 59,246 | 49 km² | 1,209 / km² |
| Sarawak | 32 | 22.3 km² | 1.4 / km² |
| Malaysia | 29.6 million | 329,840.2 km² | 89.7 / km² |
Sarikei Historical and Projected Population
Estimated Population from 1850 to 2100
- JRC (European Commission's Joint Research Centre) work on the GHS built-up grid
- CIESIN (Center for International Earth Science Information Network)
- [Link] Klein Goldewijk, K., Beusen, A., Doelman, J., and Stehfest, E.: Anthropogenic land use estimates for the Holocene – HYDE 3.2, Earth Syst. Sci. Data, 9, 927–953, https://doi.org/10.5194/essd-9-927-2017, 2017.
Area Codes
Percentage Area Codes used by businesses in Sarikei
Price Distribution
Business distribution by price for Sarikei
Human Development Index (HDI)
Statistic composite index of life expectancy, education, and per capita income.
Sarikei CO2 Emissions
Carbon Dioxide (CO2) Emissions Per Capita in Tonnes Per Year
| Location | CO2 Emissions | CO2 Emissions Per Capita | CO2 Emissions Intensity |
|---|---|---|---|
| Sarikei | 416,757 tn | 7.03 tn | 8,505.2 tons/km² |
| Sarawak | 125 tn | 3.91 tn | 5.6 tons/km² |
| Malaysia | 198,593,412 tn | 6.71 tn | 602.1 tons/km² |
| 2013 CO2 emissions (tonnes/year) | 416,757 tn |
| 2013 CO2 emissions (tonnes/year) per capita | 7.03 tn |
| 2013 CO2 emissions intensity (tonnes/km²/year) | 8,505.2 tons/km² |
Natural Hazards Risk
Relative risk out of 10
| Hazard | Risk Level |
|---|---|
| Flood | Medium (4) |
| Earthquake | Low (2) |
* Risk, particularly concerning flood or landslide, may not be for the entire area.
- Dilley, M., R.S. Chen, U. Deichmann, A.L. Lerner-Lam, M. Arnold, J. Agwe, P. Buys, O. Kjekstad, B. Lyon, and G. Yetman. 2005. Natural Disaster Hotspots: A Global Risk Analysis. Washington, D.C.: World Bank. https://doi.org/10.1596/0-8213-5930-4.
- Center for Hazards and Risk Research - CHRR - Columbia University, Center for International Earth Science Information Network - CIESIN - Columbia University. 2005. Global Flood Hazard Frequency and Distribution. Palisades, NY: NASA Socioeconomic Data and Applications Center (SEDAC). https://doi.org/10.7927/H4668B3D.
- Center for Hazards and Risk Research - CHRR - Columbia University, Center for International Earth Science Information Network - CIESIN - Columbia University. 2005. Global Earthquake Hazard Distribution - Peak Ground Acceleration. Palisades, NY: NASA Socioeconomic Data and Applications Center (SEDAC). https://doi.org/10.7927/H4BZ63ZS.
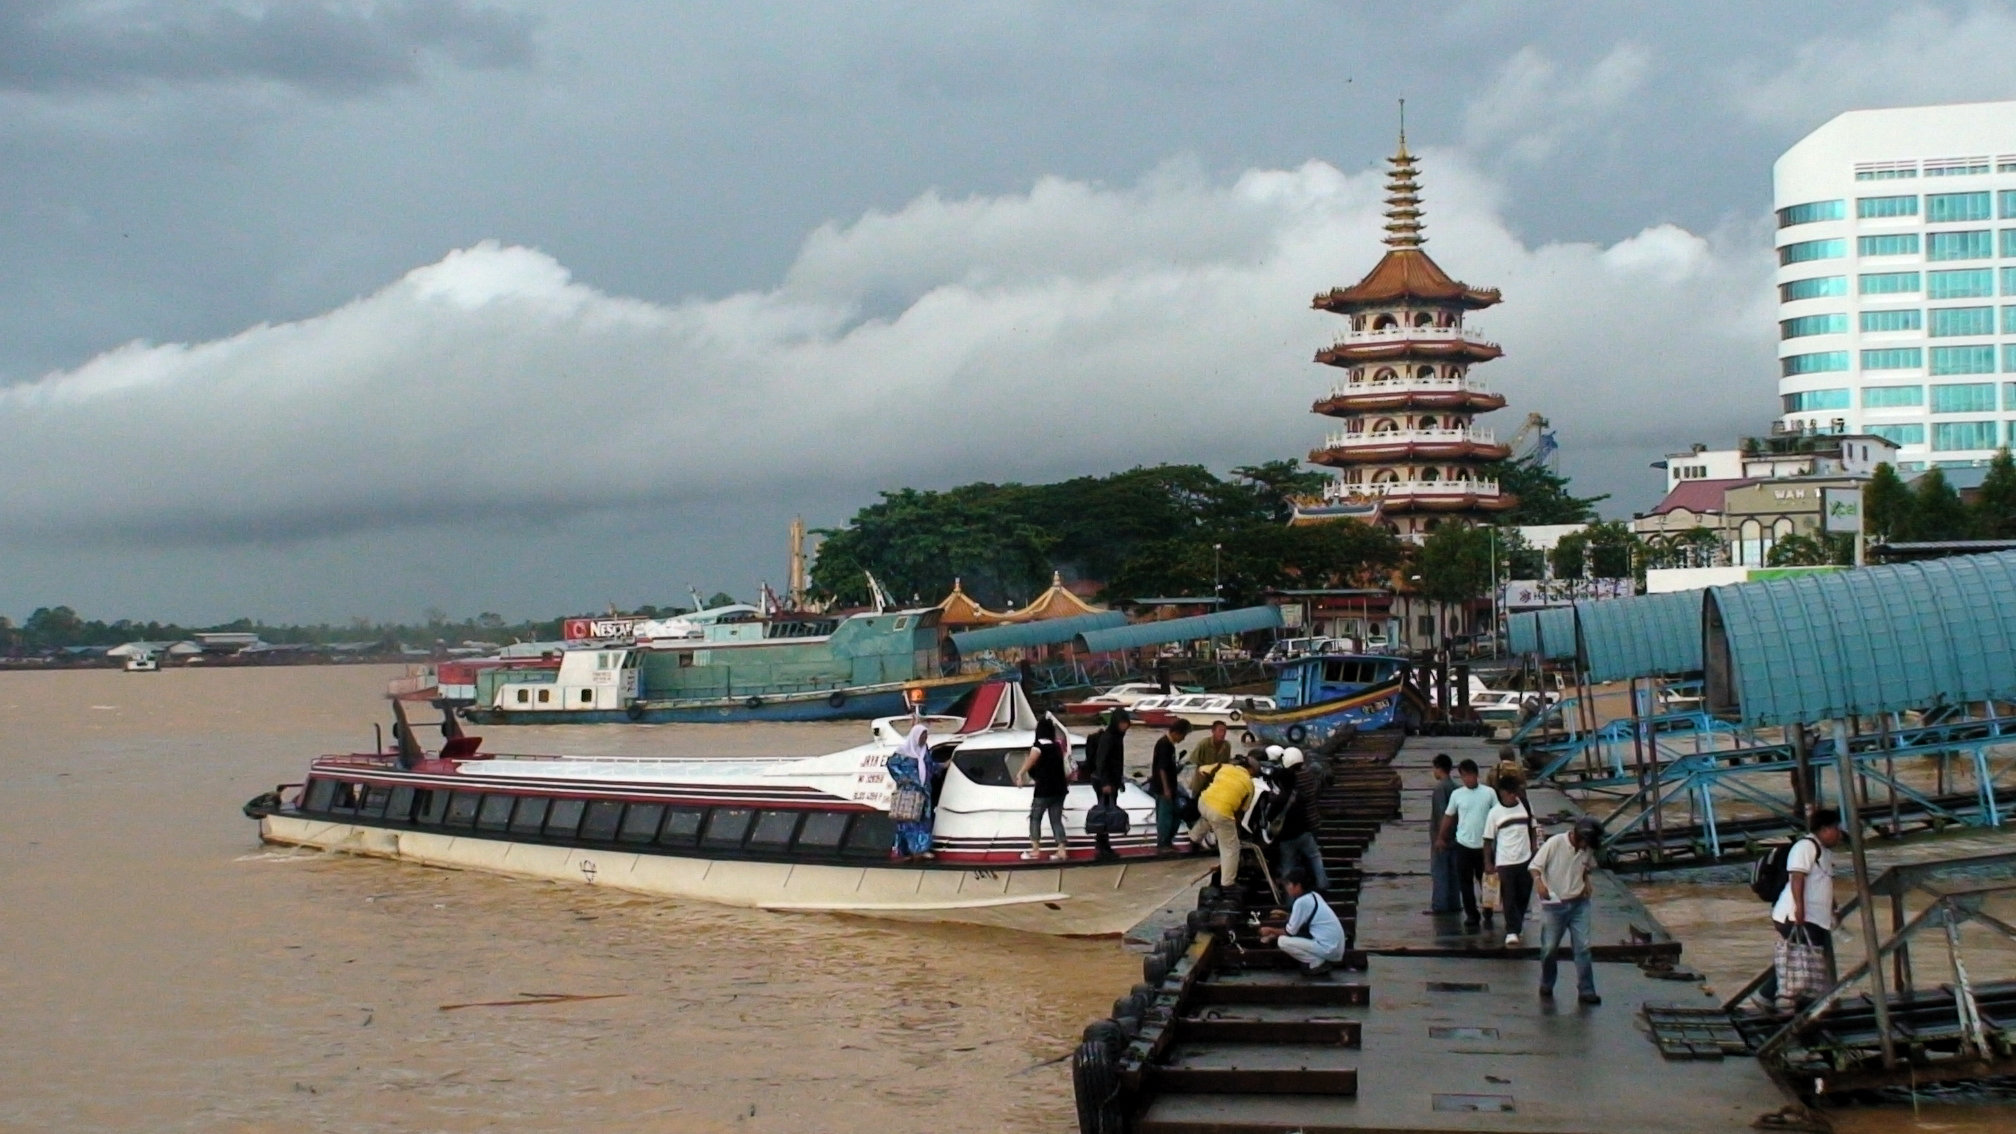
Sarikei
Sarikei (Chinese: 泗里街; pinyin: sì lǐ jiē) is a town, and the capital of the Sarikei District (985 square kilometres) in Sarikei Division, Sarawak, Malaysia. It is located on the Rajang River, near where the river empties into the South China Sea. The..
Sarikei Wikipedia Page

About Our Data
The data on this page is estimated using a number of publicly available tools and resources. It is provided without warranty, and could contain inaccuracies. Use at your own risk.