Categories in Sepang
Industries
Business Distribution by Industry in Sepang
| Industry Description | Number of Establishments |
|---|---|
| Restaurants | 885 |
| Shopping | 340 |
| Cafes | 235 |
| Other accommodation | 233 |
| Clothing stores | 214 |
| Corporate management | 197 |
| Education | 144 |
| Car repair | 122 |
| Holiday homes, cabins and resorts | 116 |
| Grocery stores and supermarkets | 114 |
Sepang Facts
| Area | 120.7 km² |
| Population | 43,305 |
| Male Population | 23,429 (54.1%) |
| Female Population | 19,876 (45.9%) |
| Population change (1975 to 2020) | +2134.5% |
| Population change (2000 to 2020) | +145.9% |
| Median Age | 24.5 years (Male: 24.8, Female: 24.2) |
| Area Codes | 6 |
| Neighborhoods | Bandar Baru Salak Tinggi, Kuala Lumpur International Airport, Kota Warisan, Pekan Sepang, Taman Seroja |
| Local Time | |
| Timezone | Malaysia Time |
| Lat & Lng | 2.69310, 101.74980 |
| Postal Codes | 43900, 43909, 64000 |
Map of Sepang
Interactive Map
Sepang Population
Years 1975 to 2020
| Data | 1975 | 1990 | 2000 | 2015 | 2020 |
|---|---|---|---|---|---|
| Population | 1,938 | 5,645 | 17,608 | 40,118 | 43,305 |
| Population Density | 16.1 / km² | 46.8 / km² | 145.9 / km² | 332.4 / km² | 358.8 / km² |
Sepang Population change from 2000 to 2015
Increase of 127.8% from year 2000 to 2015
| Location | Change since 1975 | Change since 1990 | Change since 2000 |
|---|---|---|---|
| Sepang | +1970.1% | +610.7% | +127.8% |
| Selangor | +237.9% | +103% | +45.8% |
| Malaysia | +145.8% | +66.5% | +29.4% |
Sepang Median Age
Median Age: 24.5 years
| Location | Median Age | Median Age (Female) | Median Age (Male) |
|---|---|---|---|
| Sepang | 24.5 yrs | 24.2 yrs | 24.8 yrs |
| Selangor | 26.8 yrs | 26.4 yrs | 27.1 yrs |
| Malaysia | 25.7 yrs | 25.7 yrs | 25.8 yrs |
Sepang Population Density
Population Density: 359 / km²
| Location | Population | Area | Density |
|---|---|---|---|
| Sepang | 43,305 | 120.7 km² | 359 / km² |
| Selangor | 6.1 million | 7,828.2 km² | 784 / km² |
| Malaysia | 29.6 million | 329,840.2 km² | 89.7 / km² |
Sepang Historical and Projected Population
Estimated Population from 1950 to 2100
- JRC (European Commission's Joint Research Centre) work on the GHS built-up grid
- CIESIN (Center for International Earth Science Information Network)
- [Link] Klein Goldewijk, K., Beusen, A., Doelman, J., and Stehfest, E.: Anthropogenic land use estimates for the Holocene – HYDE 3.2, Earth Syst. Sci. Data, 9, 927–953, https://doi.org/10.5194/essd-9-927-2017, 2017.
Neighborhoods in Sepang
Percentage of businesses by neighborhood in Sepang
Area Codes
Percentage Area Codes used by businesses in Sepang
Postal Codes
Percentage of businesses by Postal Codes in Sepang
Price Distribution
Business distribution by price for Sepang
Human Development Index (HDI)
Statistic composite index of life expectancy, education, and per capita income.
Sepang CO2 Emissions
Carbon Dioxide (CO2) Emissions Per Capita in Tonnes Per Year
| Location | CO2 Emissions | CO2 Emissions Per Capita | CO2 Emissions Intensity |
|---|---|---|---|
| Sepang | 395,222 tn | 9.13 tn | 3,274.8 tons/km² |
| Selangor | 54,361,620 tn | 8.86 tn | 6,944.3 tons/km² |
| Malaysia | 198,593,412 tn | 6.71 tn | 602.1 tons/km² |
| 2013 CO2 emissions (tonnes/year) | 395,222 tn |
| 2013 CO2 emissions (tonnes/year) per capita | 9.13 tn |
| 2013 CO2 emissions intensity (tonnes/km²/year) | 3,274.8 tons/km² |
Natural Hazards Risk
Relative risk out of 10
| Hazard | Risk Level |
|---|---|
| Flood | High (9) |
| Earthquake | Medium (4) |
* Risk, particularly concerning flood or landslide, may not be for the entire area.
- Dilley, M., R.S. Chen, U. Deichmann, A.L. Lerner-Lam, M. Arnold, J. Agwe, P. Buys, O. Kjekstad, B. Lyon, and G. Yetman. 2005. Natural Disaster Hotspots: A Global Risk Analysis. Washington, D.C.: World Bank. https://doi.org/10.1596/0-8213-5930-4.
- Center for Hazards and Risk Research - CHRR - Columbia University, Center for International Earth Science Information Network - CIESIN - Columbia University. 2005. Global Flood Hazard Frequency and Distribution. Palisades, NY: NASA Socioeconomic Data and Applications Center (SEDAC). https://doi.org/10.7927/H4668B3D.
- Center for Hazards and Risk Research - CHRR - Columbia University, Center for International Earth Science Information Network - CIESIN - Columbia University. 2005. Global Earthquake Hazard Distribution - Peak Ground Acceleration. Palisades, NY: NASA Socioeconomic Data and Applications Center (SEDAC). https://doi.org/10.7927/H4BZ63ZS.
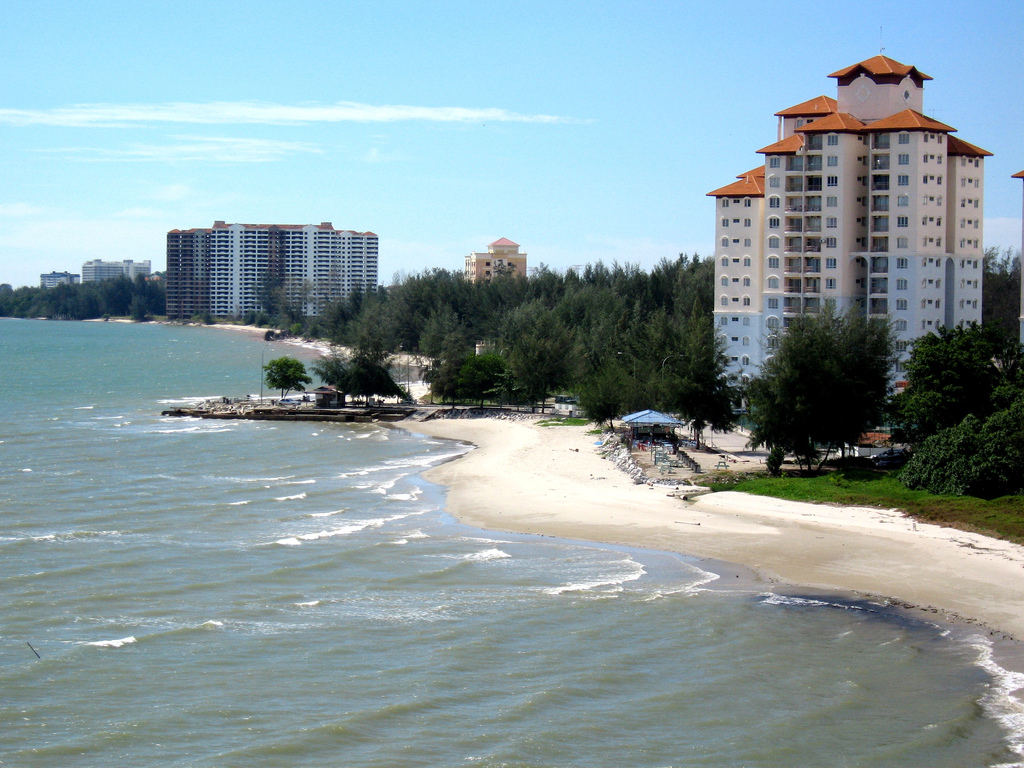
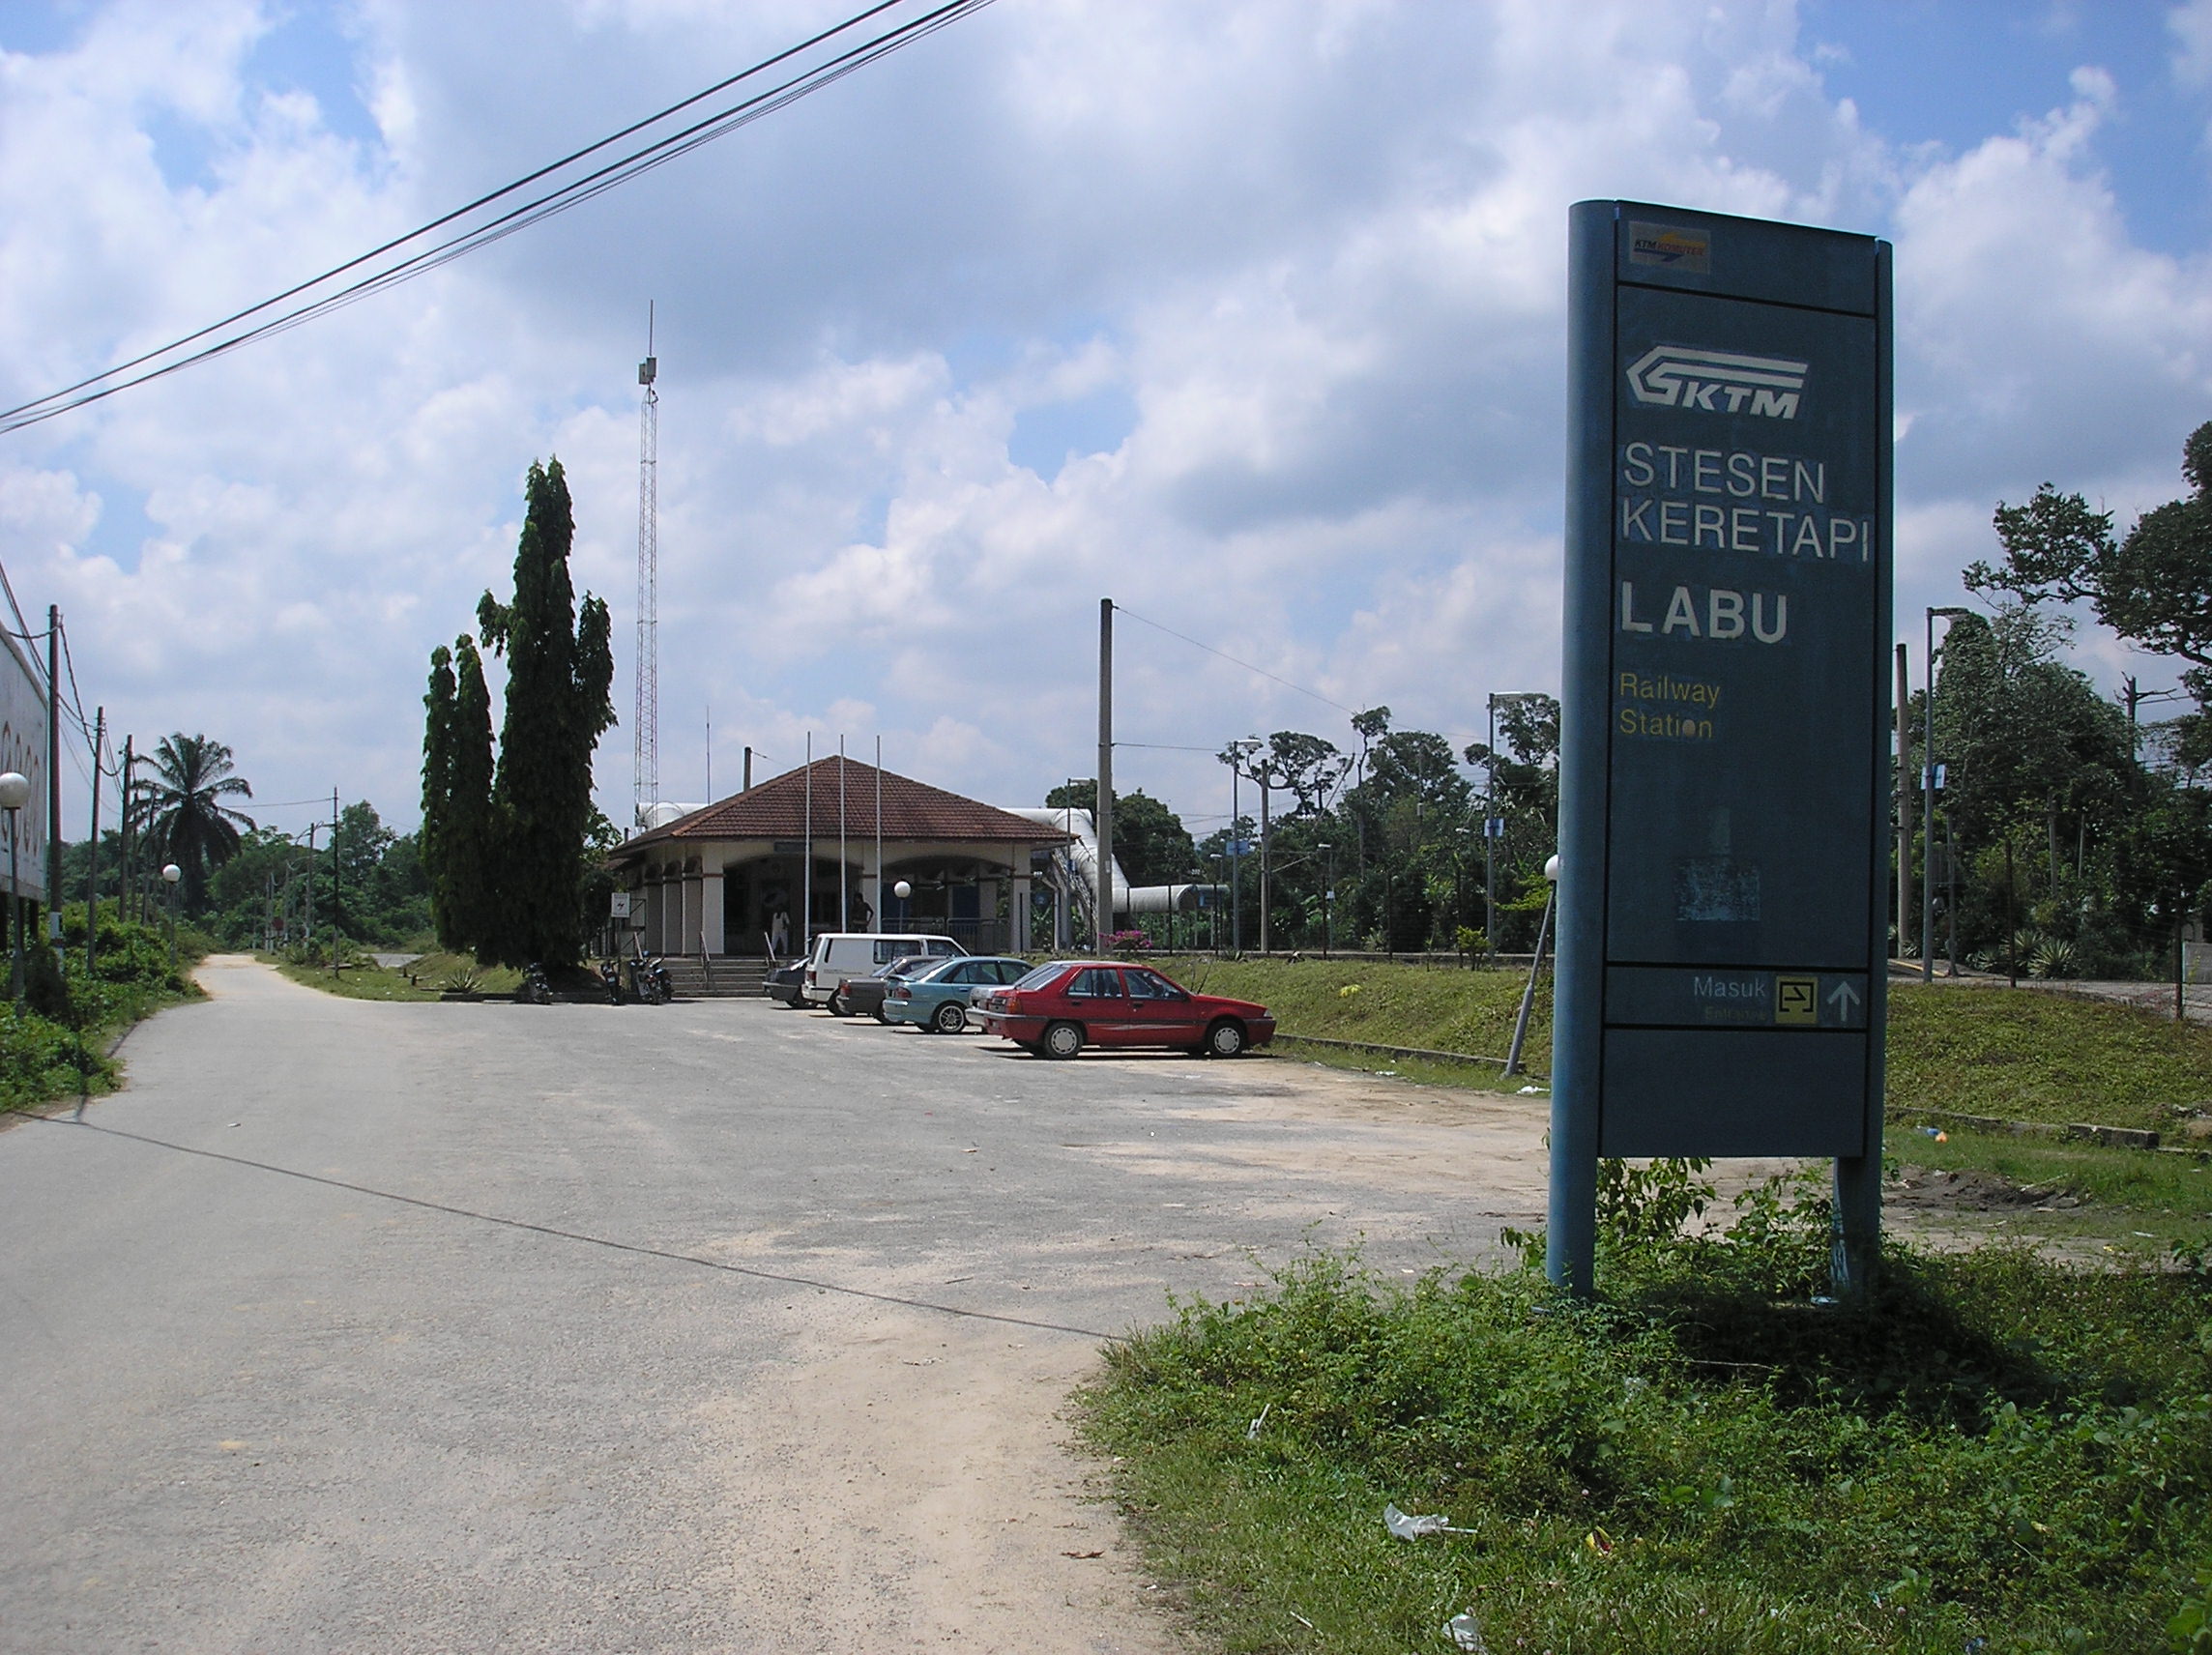
Sepang
Sepang is a town and district located in the southern part of the state of Selangor in Malaysia. Formerly a small town, Sepang grew to several recent developments. Sepang District covers an area of 612 square kilometres, and had a population of 212,0..
Sepang Wikipedia Page

About Our Data
The data on this page is estimated using a number of publicly available tools and resources. It is provided without warranty, and could contain inaccuracies. Use at your own risk.